


Suite Analysis
abstract
Suite Analysis is designed to help identify and quickly fix the steps causing most failures in flowcharts execution. Historical results for each flowchart which have at least one failure history are also provided.
This feature is available since Sahi Pro V11.5.0.
Suite analysis report helps to analyze the reports and pinpoint the source of failures.
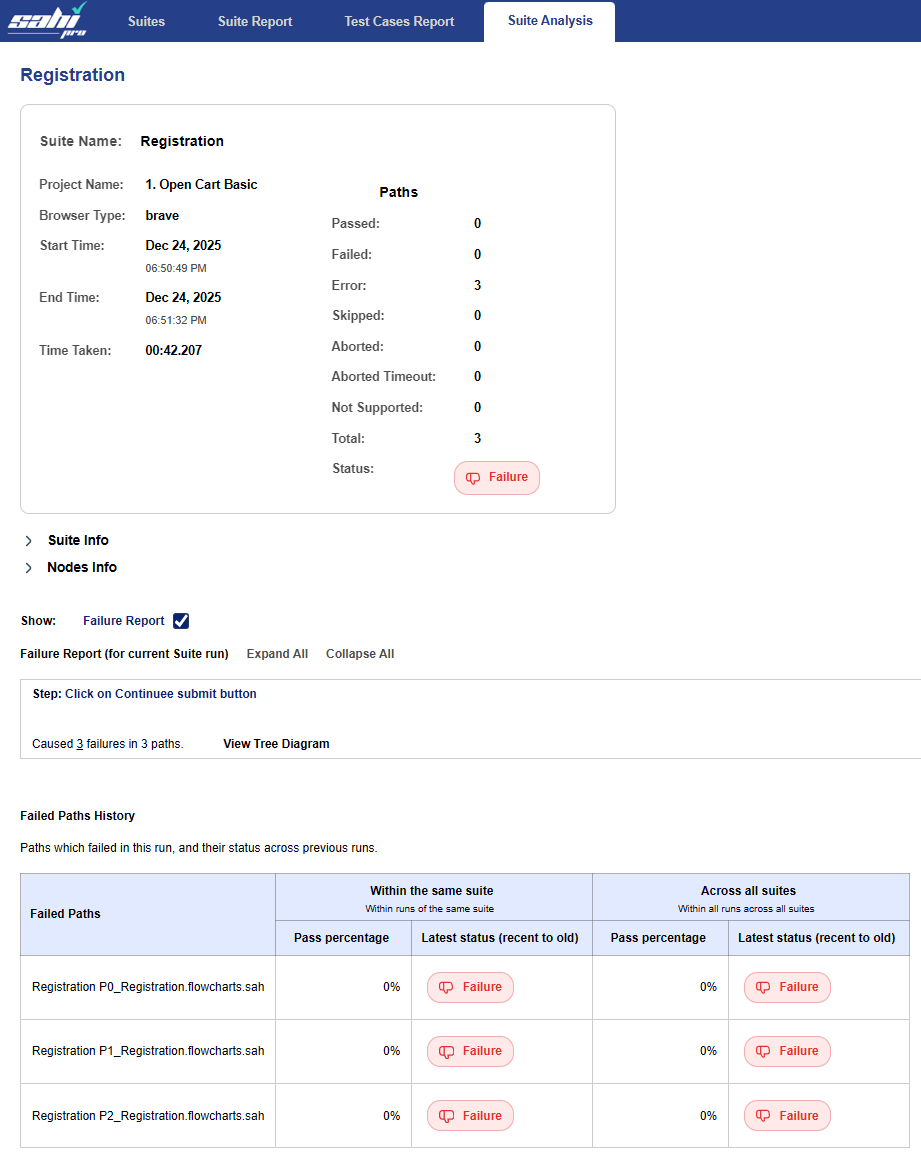
Suite Analysis Report
Click on Suite Analysis Tab on Suite Report Page.
Stepgives the first step which has failed.Number of Steps Failedlink gives the total number of steps failed in the whole flowchart/project. Click on the link to see all failed steps.Tree structureshows all the flowchart, path and type of validation called in between the failed step and flowchart/ path got failed because of the step.Affected Path Reportssection contains the paths which are failed. Clicking on the path takes you to the corresponding path report.
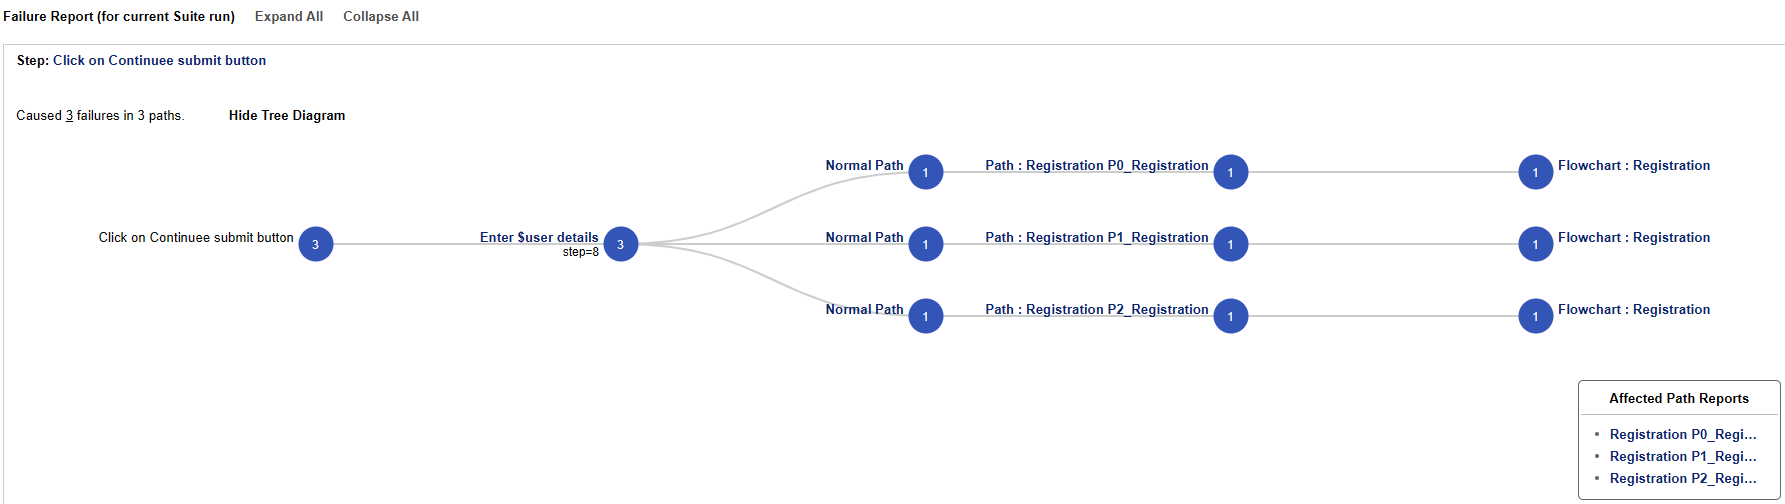 In the image above, it is seen that
 Click on Continuee submit button was called from Enter $user details keyword, which in turn was called by 3 different paths of same flowchart.
If this one step is fixed, all the 3 paths will start working.
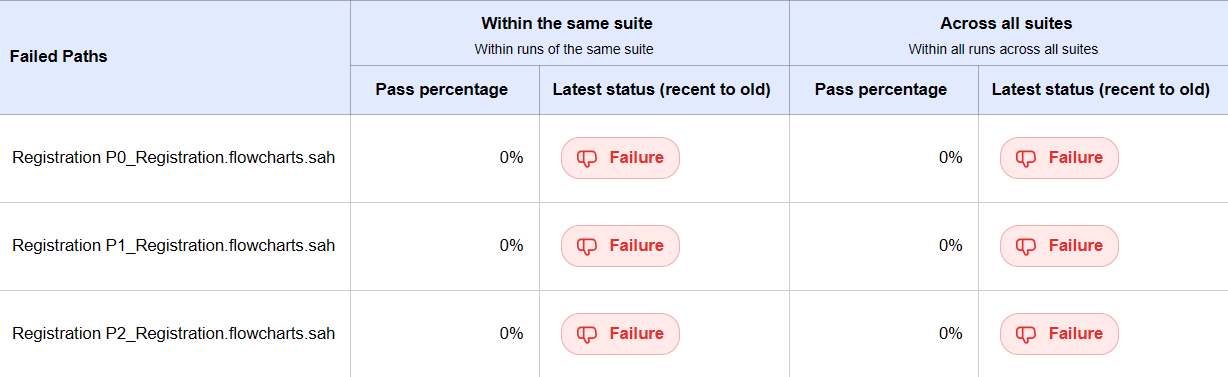
Failed Paths History
The history of past run results for the failed paths along with their pass percentage are showcased in this table. It helps to keep track of failed paths. The history tables are categorized into 2 as:Within the same suite: paths executed from the same flowchart/project is considered in this section.Across all suites: This section covers the history of path whenever it is executed irrespective of the flowchart/project from which it is executed.
info
Latest status column gives, the status of each path execution shown as corresponding status batches.
The sequence of status shown starts with the most recent execution.
Passed Paths With Failure History
Paths which are passed in the current flowchart/project but having atleast one failure history are displayed here.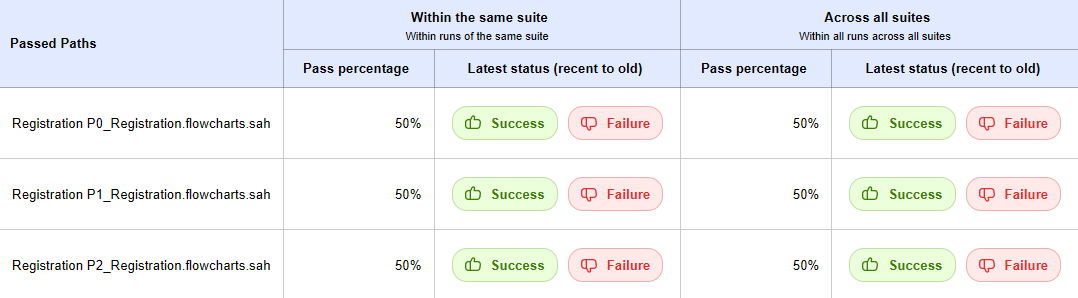
-
A flowchart may run multiple times if
Retry Countis specified in Advanced Run Settings. In such cases, final status of the path is displayed followed by corresponding statuses of the previous runs.
For example, if a flowchart is retried 1 time after it fails in the first run, and if it fails in the second run as well, then two FAILURE statuses are shown in the Failed flowchart History table.
infoNote: Flowcharts or paths which are in ABORTED and ERROR statuses are considered as FAILURE.
Maximum number of report statuses shown in the table can be configured by setting below property in sahi_pro/userdata/config/userdata.properties. Default value is 10.
sahi.count.script_status_to_be_shown=10