

Javascript Code Coverage
Sahi Pro can measure how much of the web application's JavaScript your tests run, by function and by decision point, for each JavaScript file.
Passing tests don’t tell you how much of the application they checked. JS Code Coverage measures how much of the application’s JavaScript your tests actually ran: which functions were called, and which branches of each decision, such as both sides of an if, were taken. Parts that no test reaches are the ones to write tests for next.
Turn On JS Code Coverage
Section titled “Turn On JS Code Coverage”For All Test Runs
Section titled “For All Test Runs”Set this in userdata/config/userdata.properties:
js.code_coverage.enabled.default=trueFor One Test Run
Section titled “For One Test Run”In the Run Configuration, open Advanced Settings and tick JS Code Coverage:
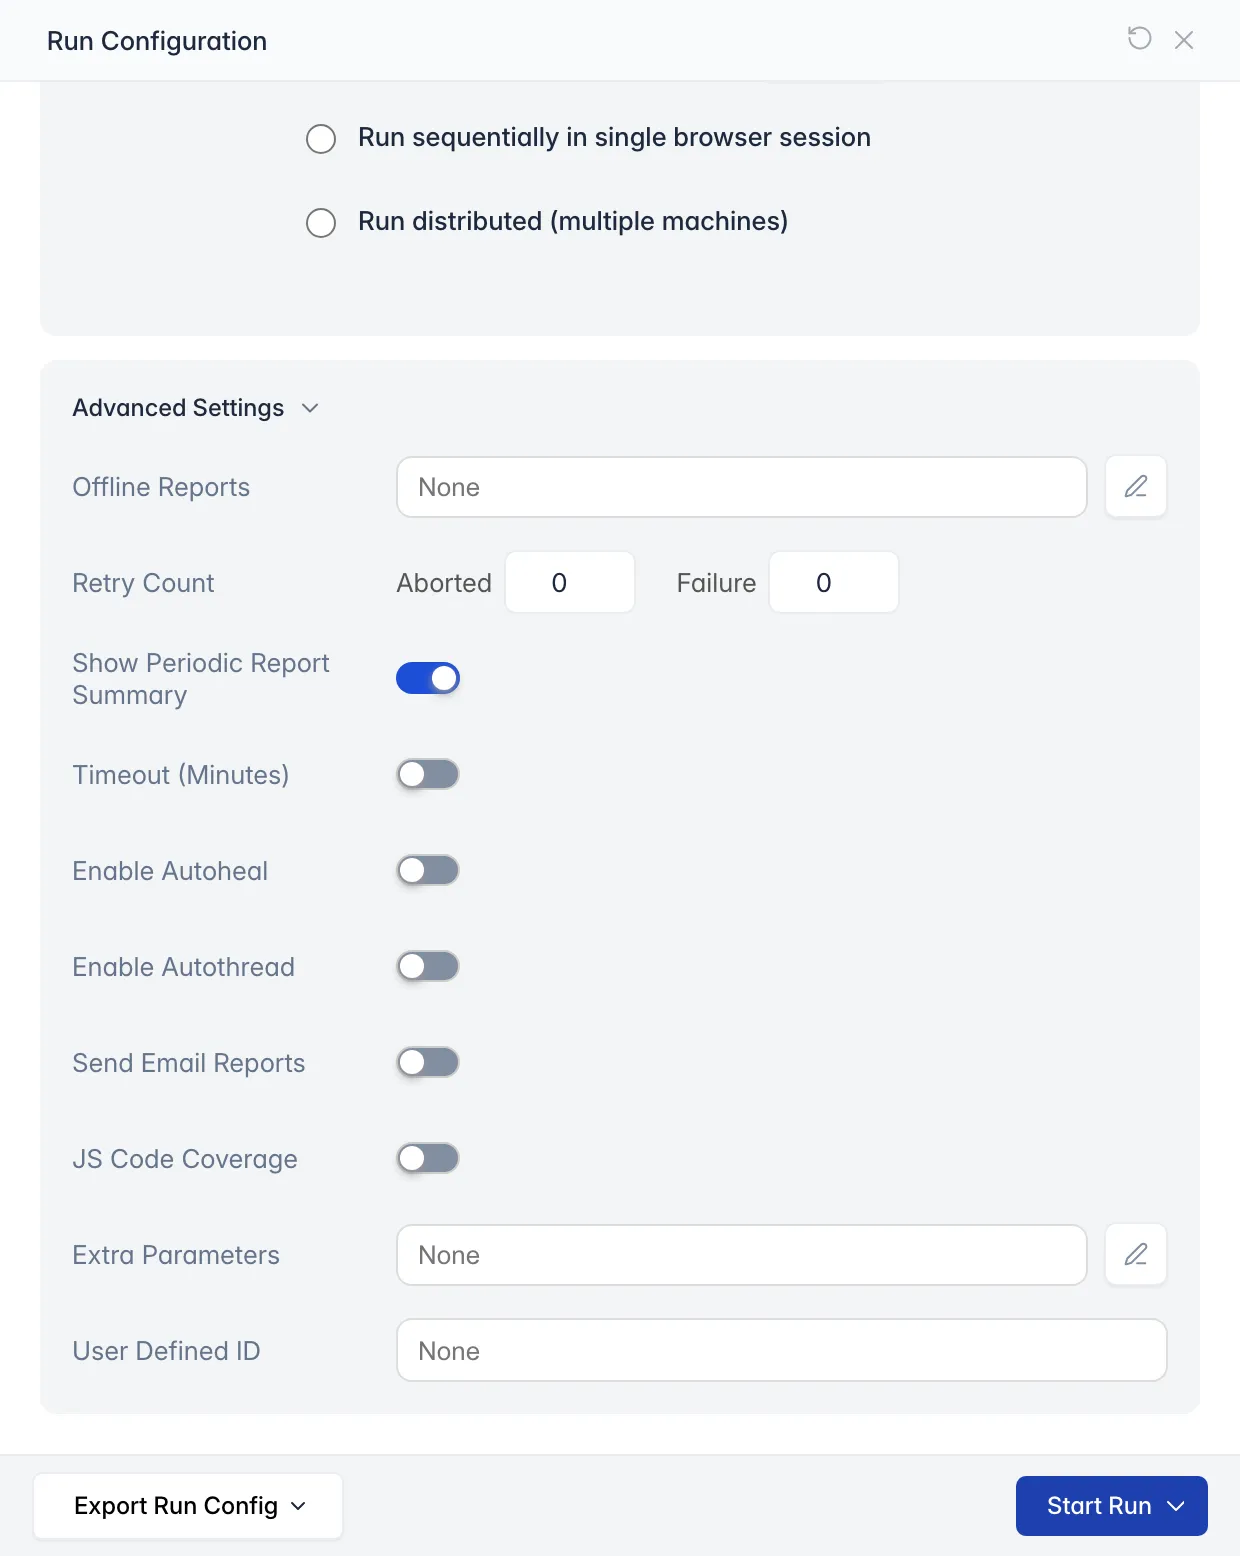
See Run Tests via Editor for the other settings.
JS Code Coverage Report
Section titled “JS Code Coverage Report”Open the suite report of the run, and click the JS Code Coverage tab:
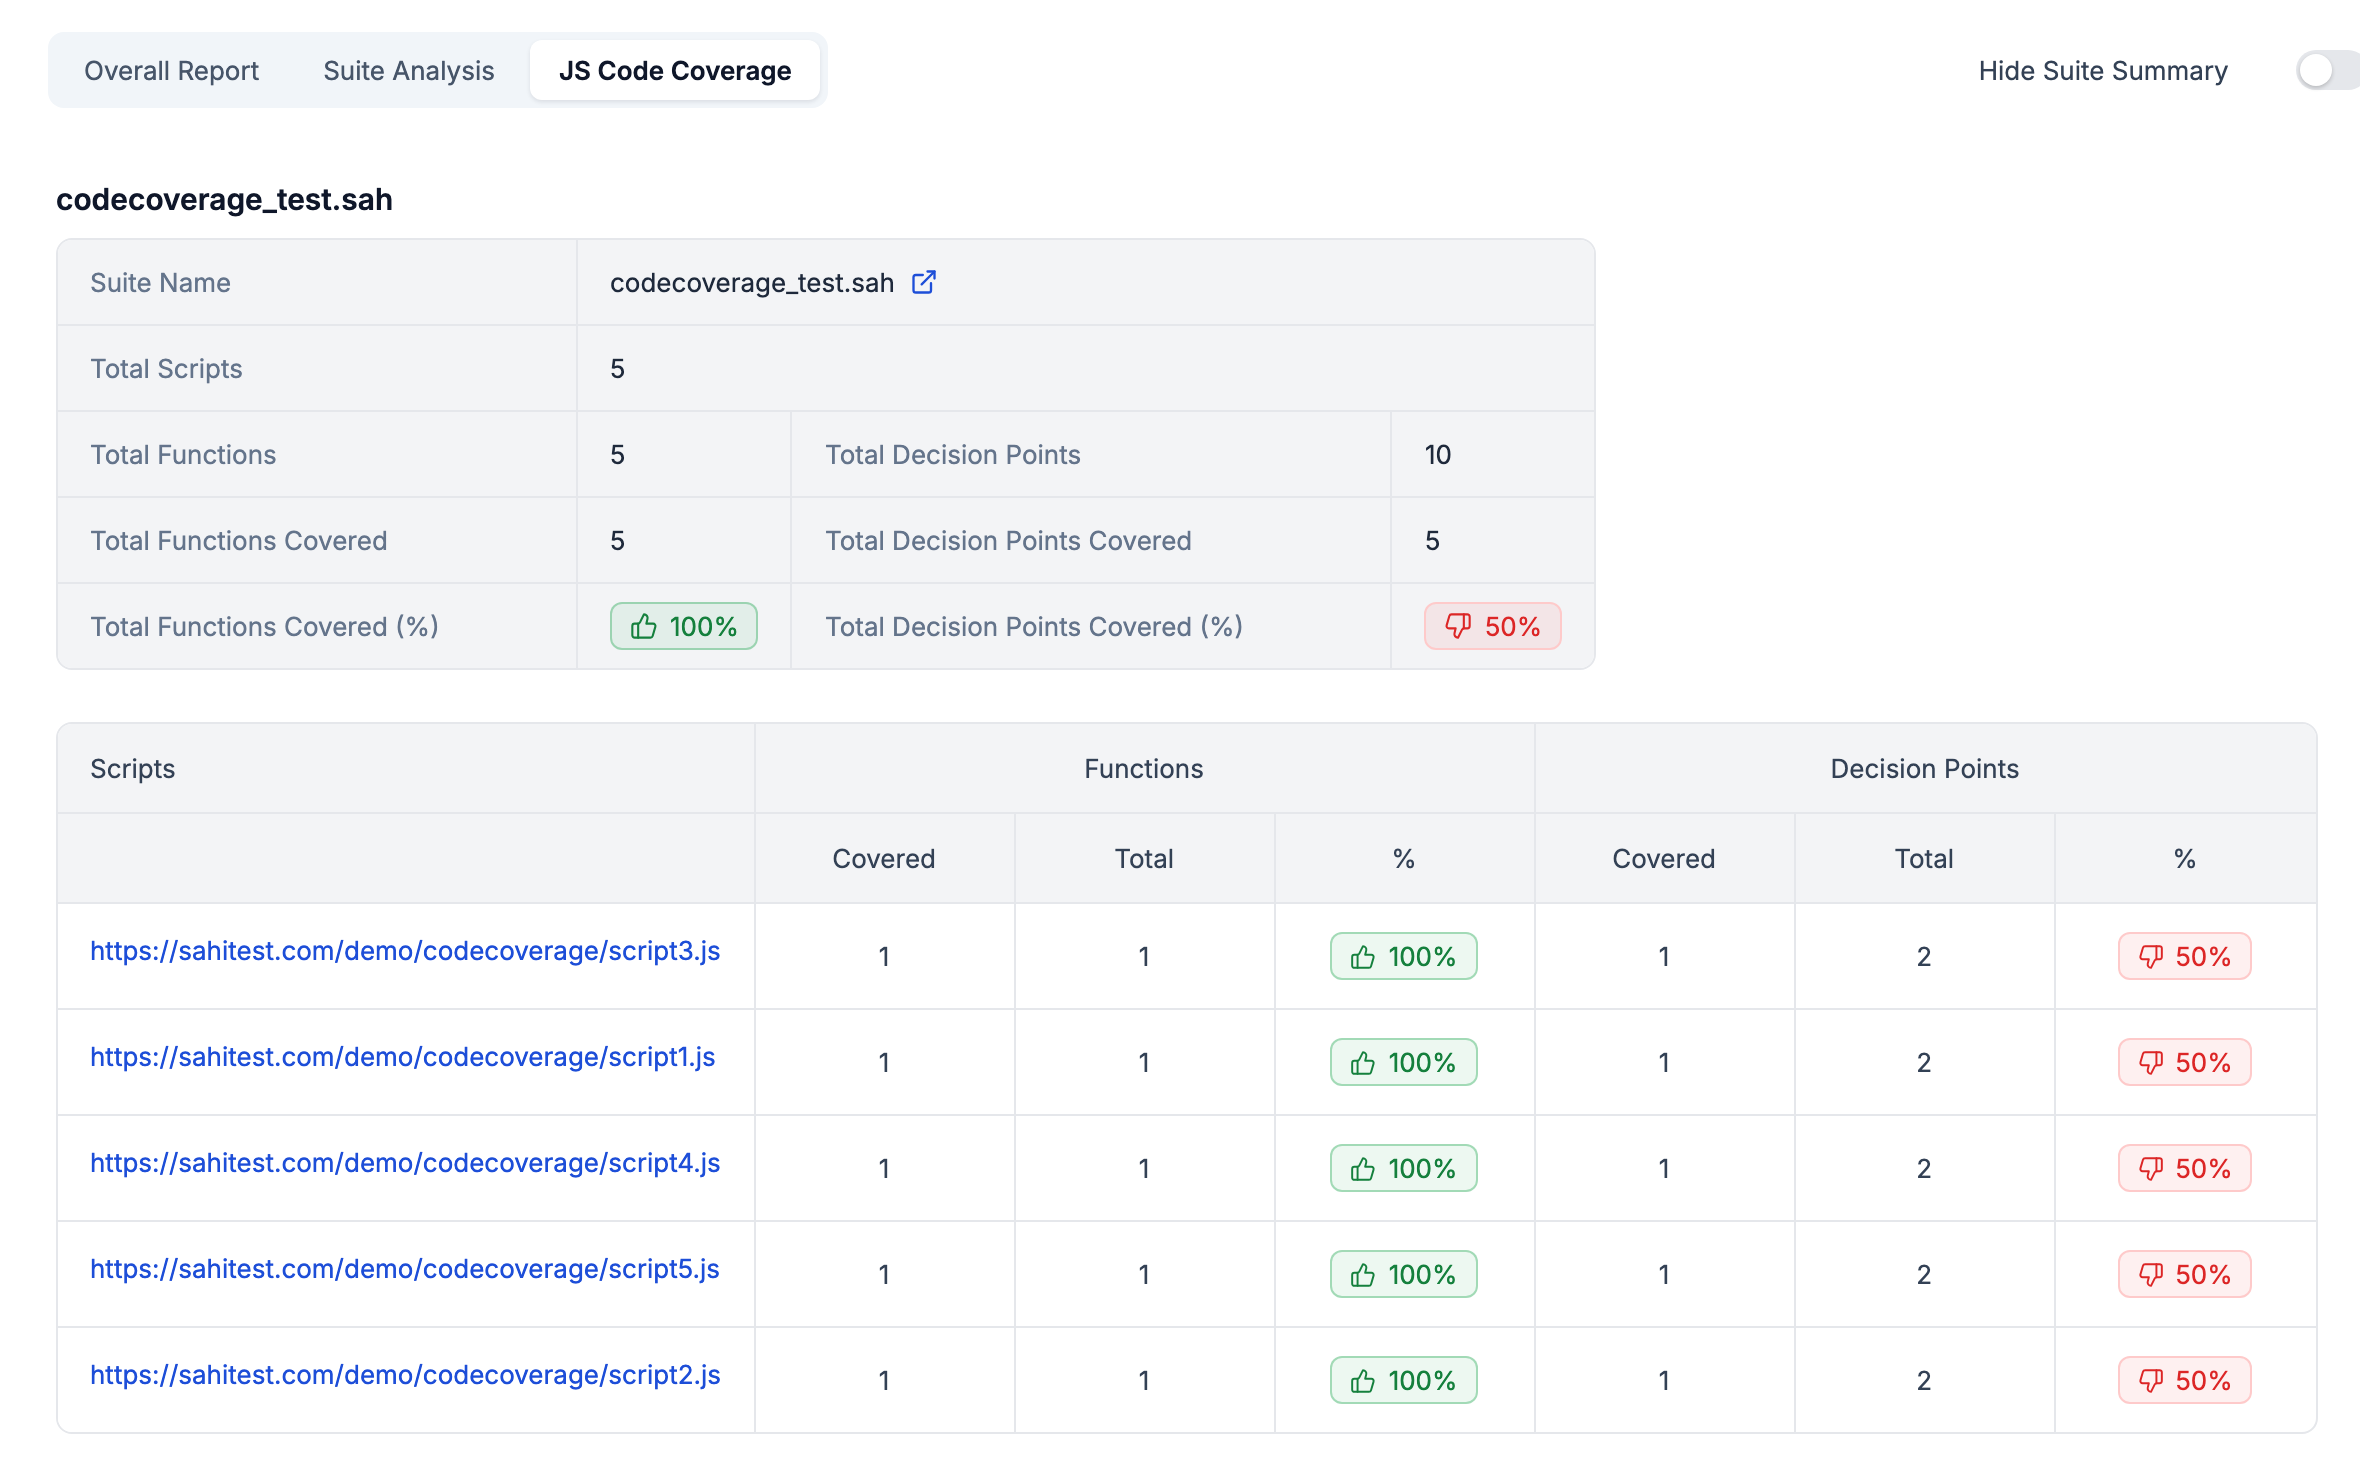
The summary at the top shows, for the whole run:
- Total Scripts: the number of JavaScript files the run loaded.
- Total Functions and Total Functions Covered: how many functions the files have, and how many the run called.
- Total Decision Points and Total Decision Points Covered: how many branches the files have, such as each side of an
iforelse, and how many the run took.
Below it, the table shows the same numbers for each JavaScript file.
A percentage above 50% is green with a thumbs-up. 50% or less is red with a thumbs-down.
Click a file to see its code, with the number of times each function and branch ran next to it. A count of 0, in red, is code that no test ran:

In this example, the test clicked the button that calls performAction1(), so the function and its if branch ran once. The else branch never ran, so half the decision points are covered.