

Suite Analysis
Suite Analysis shows which steps caused the failures and healed steps in a suite run, which scenario files they affected, and how each file has done across earlier runs.
When a suite fails, a lot of time can go into going through the results to find the real problem. Often many failures come from very few steps: when you know that 23 failing scenario files all fail because of the same 3 steps, fixing and rerunning is quick. Suite Analysis finds those steps for you, and shows how each scenario file has done in earlier runs.
Open Suite Analysis
Section titled “Open Suite Analysis”Open the suite report of a run, and click the Suite Analysis tab:
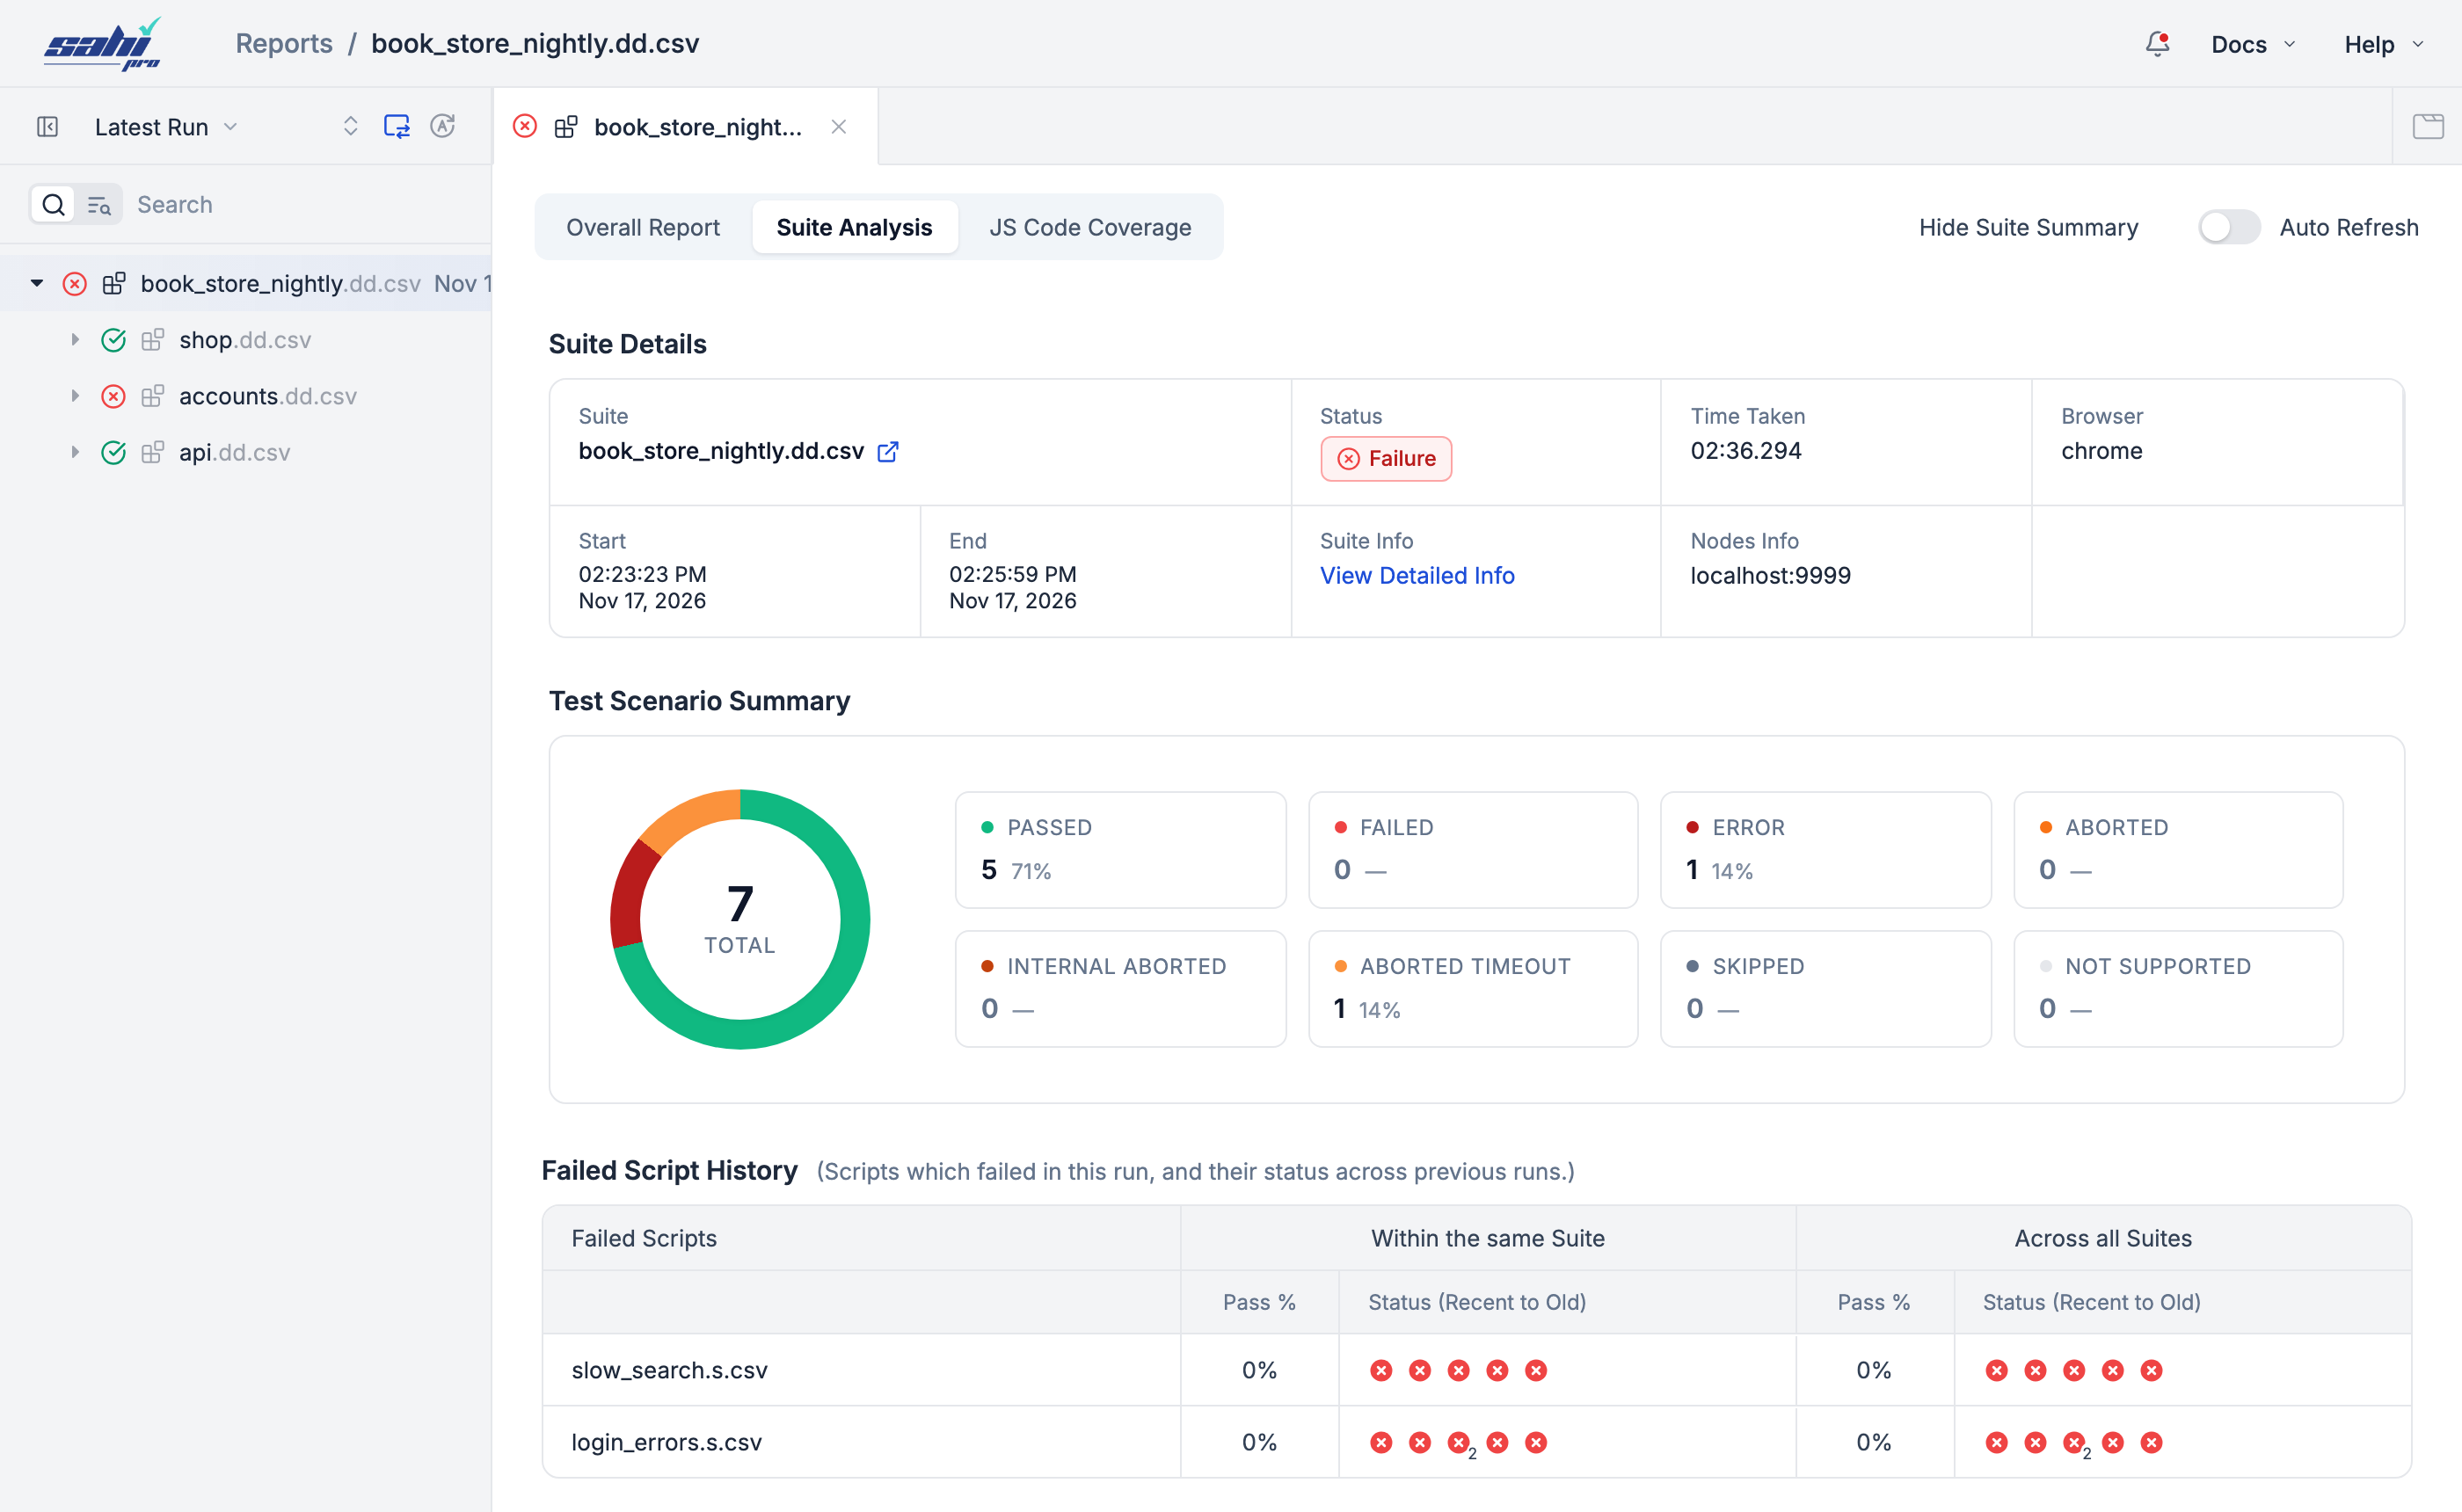
It starts with the Suite Details and the Test Scenario Summary, then has three parts: the Failed Script History, the Passed Scripts With Failure History, and the Failure & Healed Report.
Failure & Healed Report
Section titled “Failure & Healed Report”The Failure & Healed Report lists each step that failed or was healed in this run, and how many scenario files it affected:
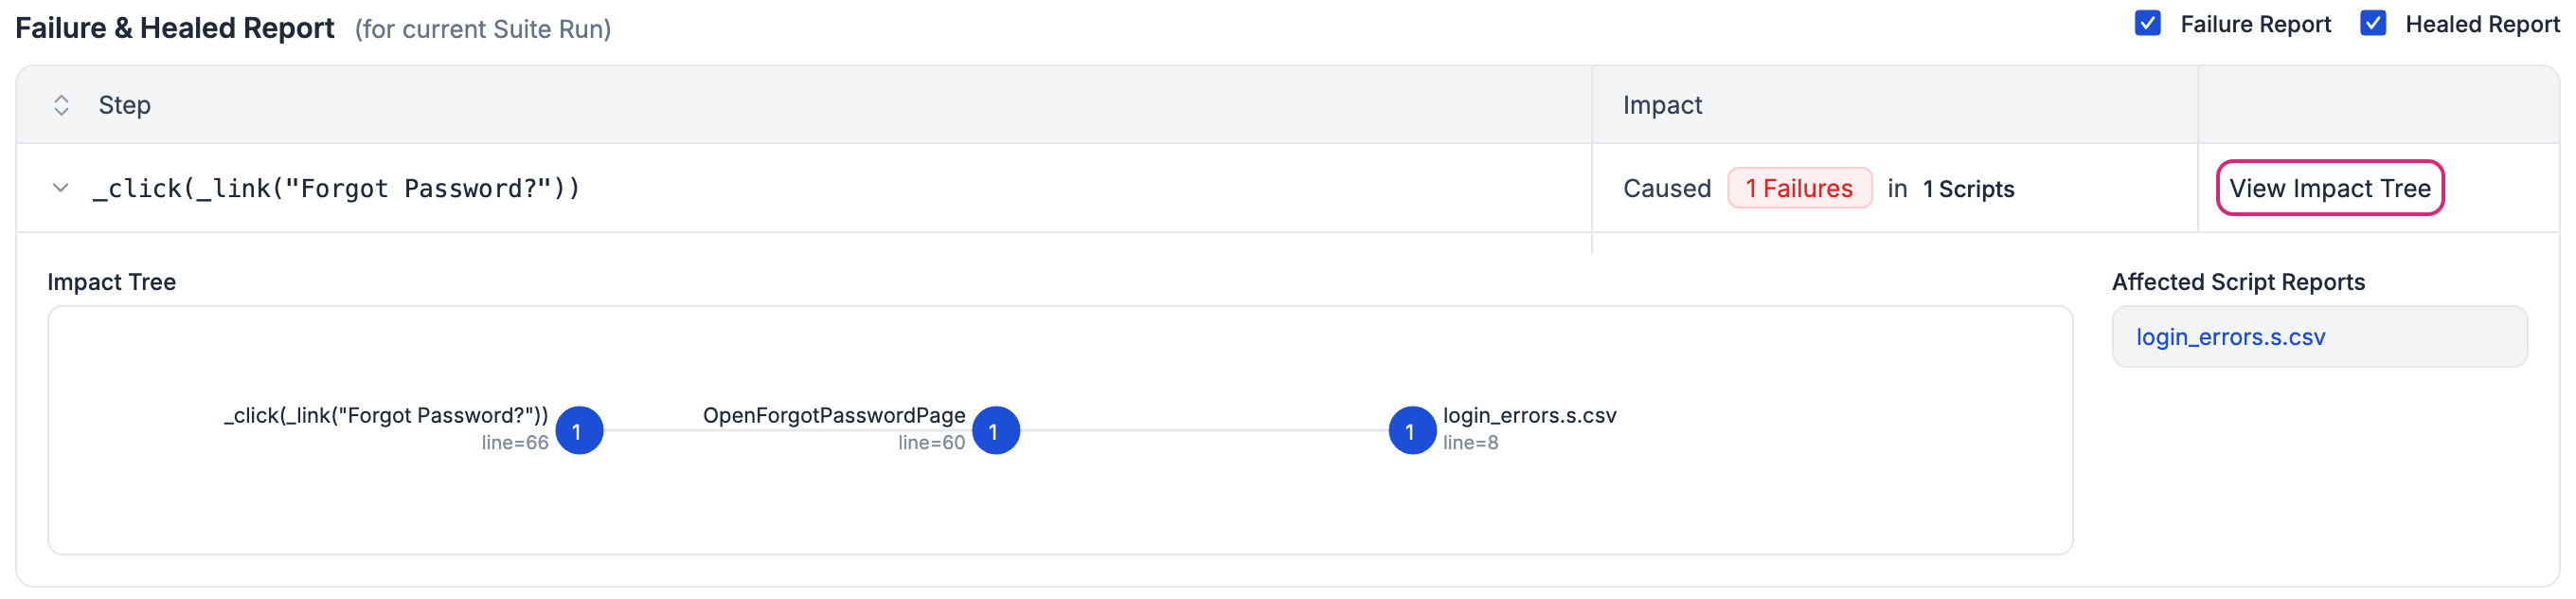
- Step: the step that failed, such as
_click(_link("Forgot Password?")). Click the arrow next to it to show or hide its impact tree. - Impact: how many failures the step caused, in how many scenario files, such as “Caused 1 Failures in 1 Scripts”.
- View Impact Tree shows the path from the step to each scenario file it broke: the step and its line, the keywords or functions that called it, and the scenario files. A step inside a keyword used by many scenario files shows a branch for each one, so you can see that fixing this one step fixes all of them.
- Affected Script Reports lists the scenario files that failed because of the step. Click one to open its script report.
Healed steps are listed the same way, as Autoheals, such as “Caused 1 Autoheals in 1 Scripts”. Each one is a step to update in your tests, before the page changes again:

Untick Failure Report or Healed Report at the top right to hide failures or healed steps.
Failed Script History
Section titled “Failed Script History”Is a scenario file failing for the first time, or has it been failing for a while? The Failed Script History answers this for each file that failed in this run. Passed Scripts With Failure History does the same for files that passed this time but failed before, which can point to tests that pass and fail at random:
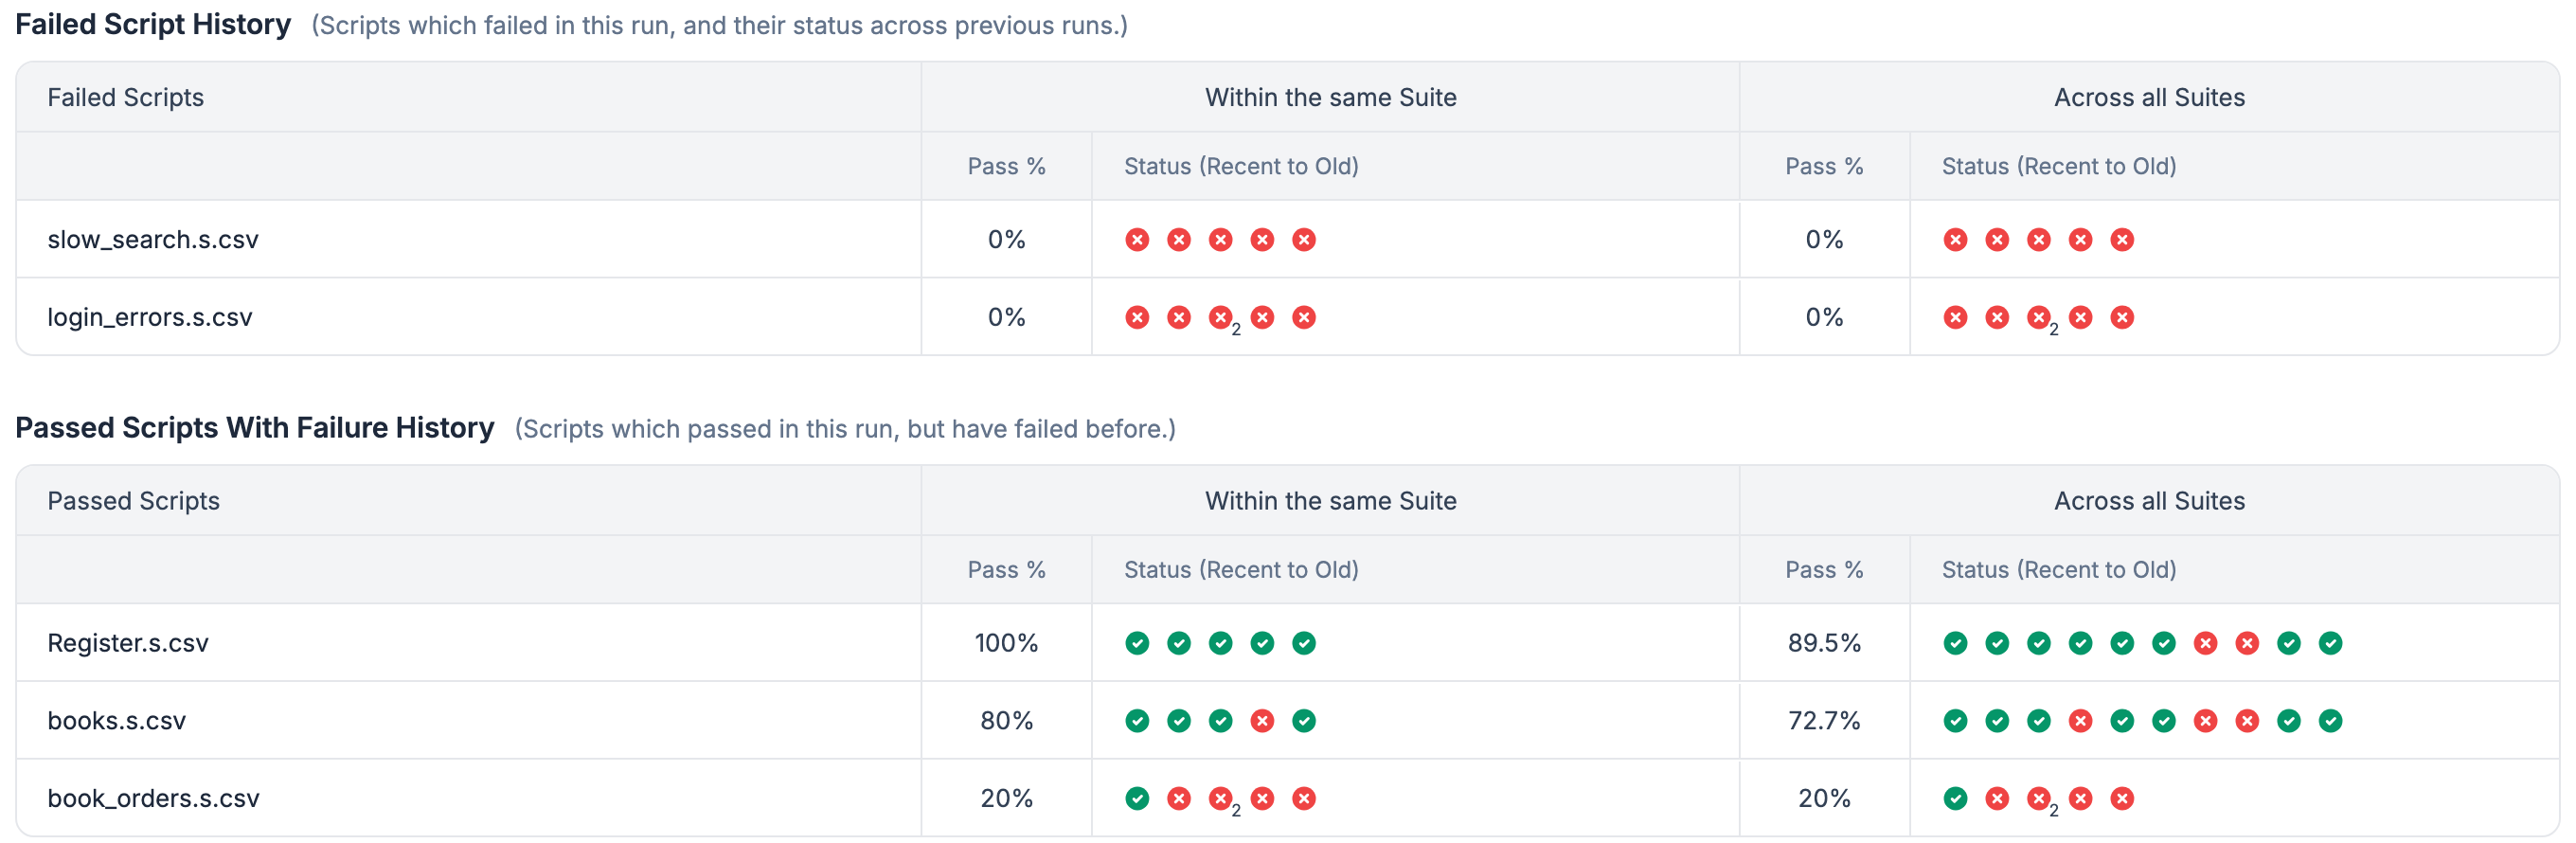
Each table shows the history twice:
- Within the same Suite: the runs of the file in this suite only.
- Across all Suites: every run of the file, in any suite.
For each, Pass % is the share of those runs that passed, and Status (Recent to Old) shows a status icon for each run, starting with the latest. A small number next to an icon means the file was retried in that run: it shows how many times it ran. For example, if a file fails, is retried once with Retry Count and fails again, its icon shows 2.
To change how many runs the tables show, set this in userdata/config/userdata.properties. The default is 10:
sahi.count.script_status_to_be_shown=10