

Suite Report
Read a suite report: the navigator, Suite Details, the result charts, the time each scenario file took, and every scenario file and test case in the run.
A suite report shows one run of a suite. It starts with the big picture, how many scenario files and test cases passed, and lets you drill down to the one that failed. Click a suite in the reports list to open it.
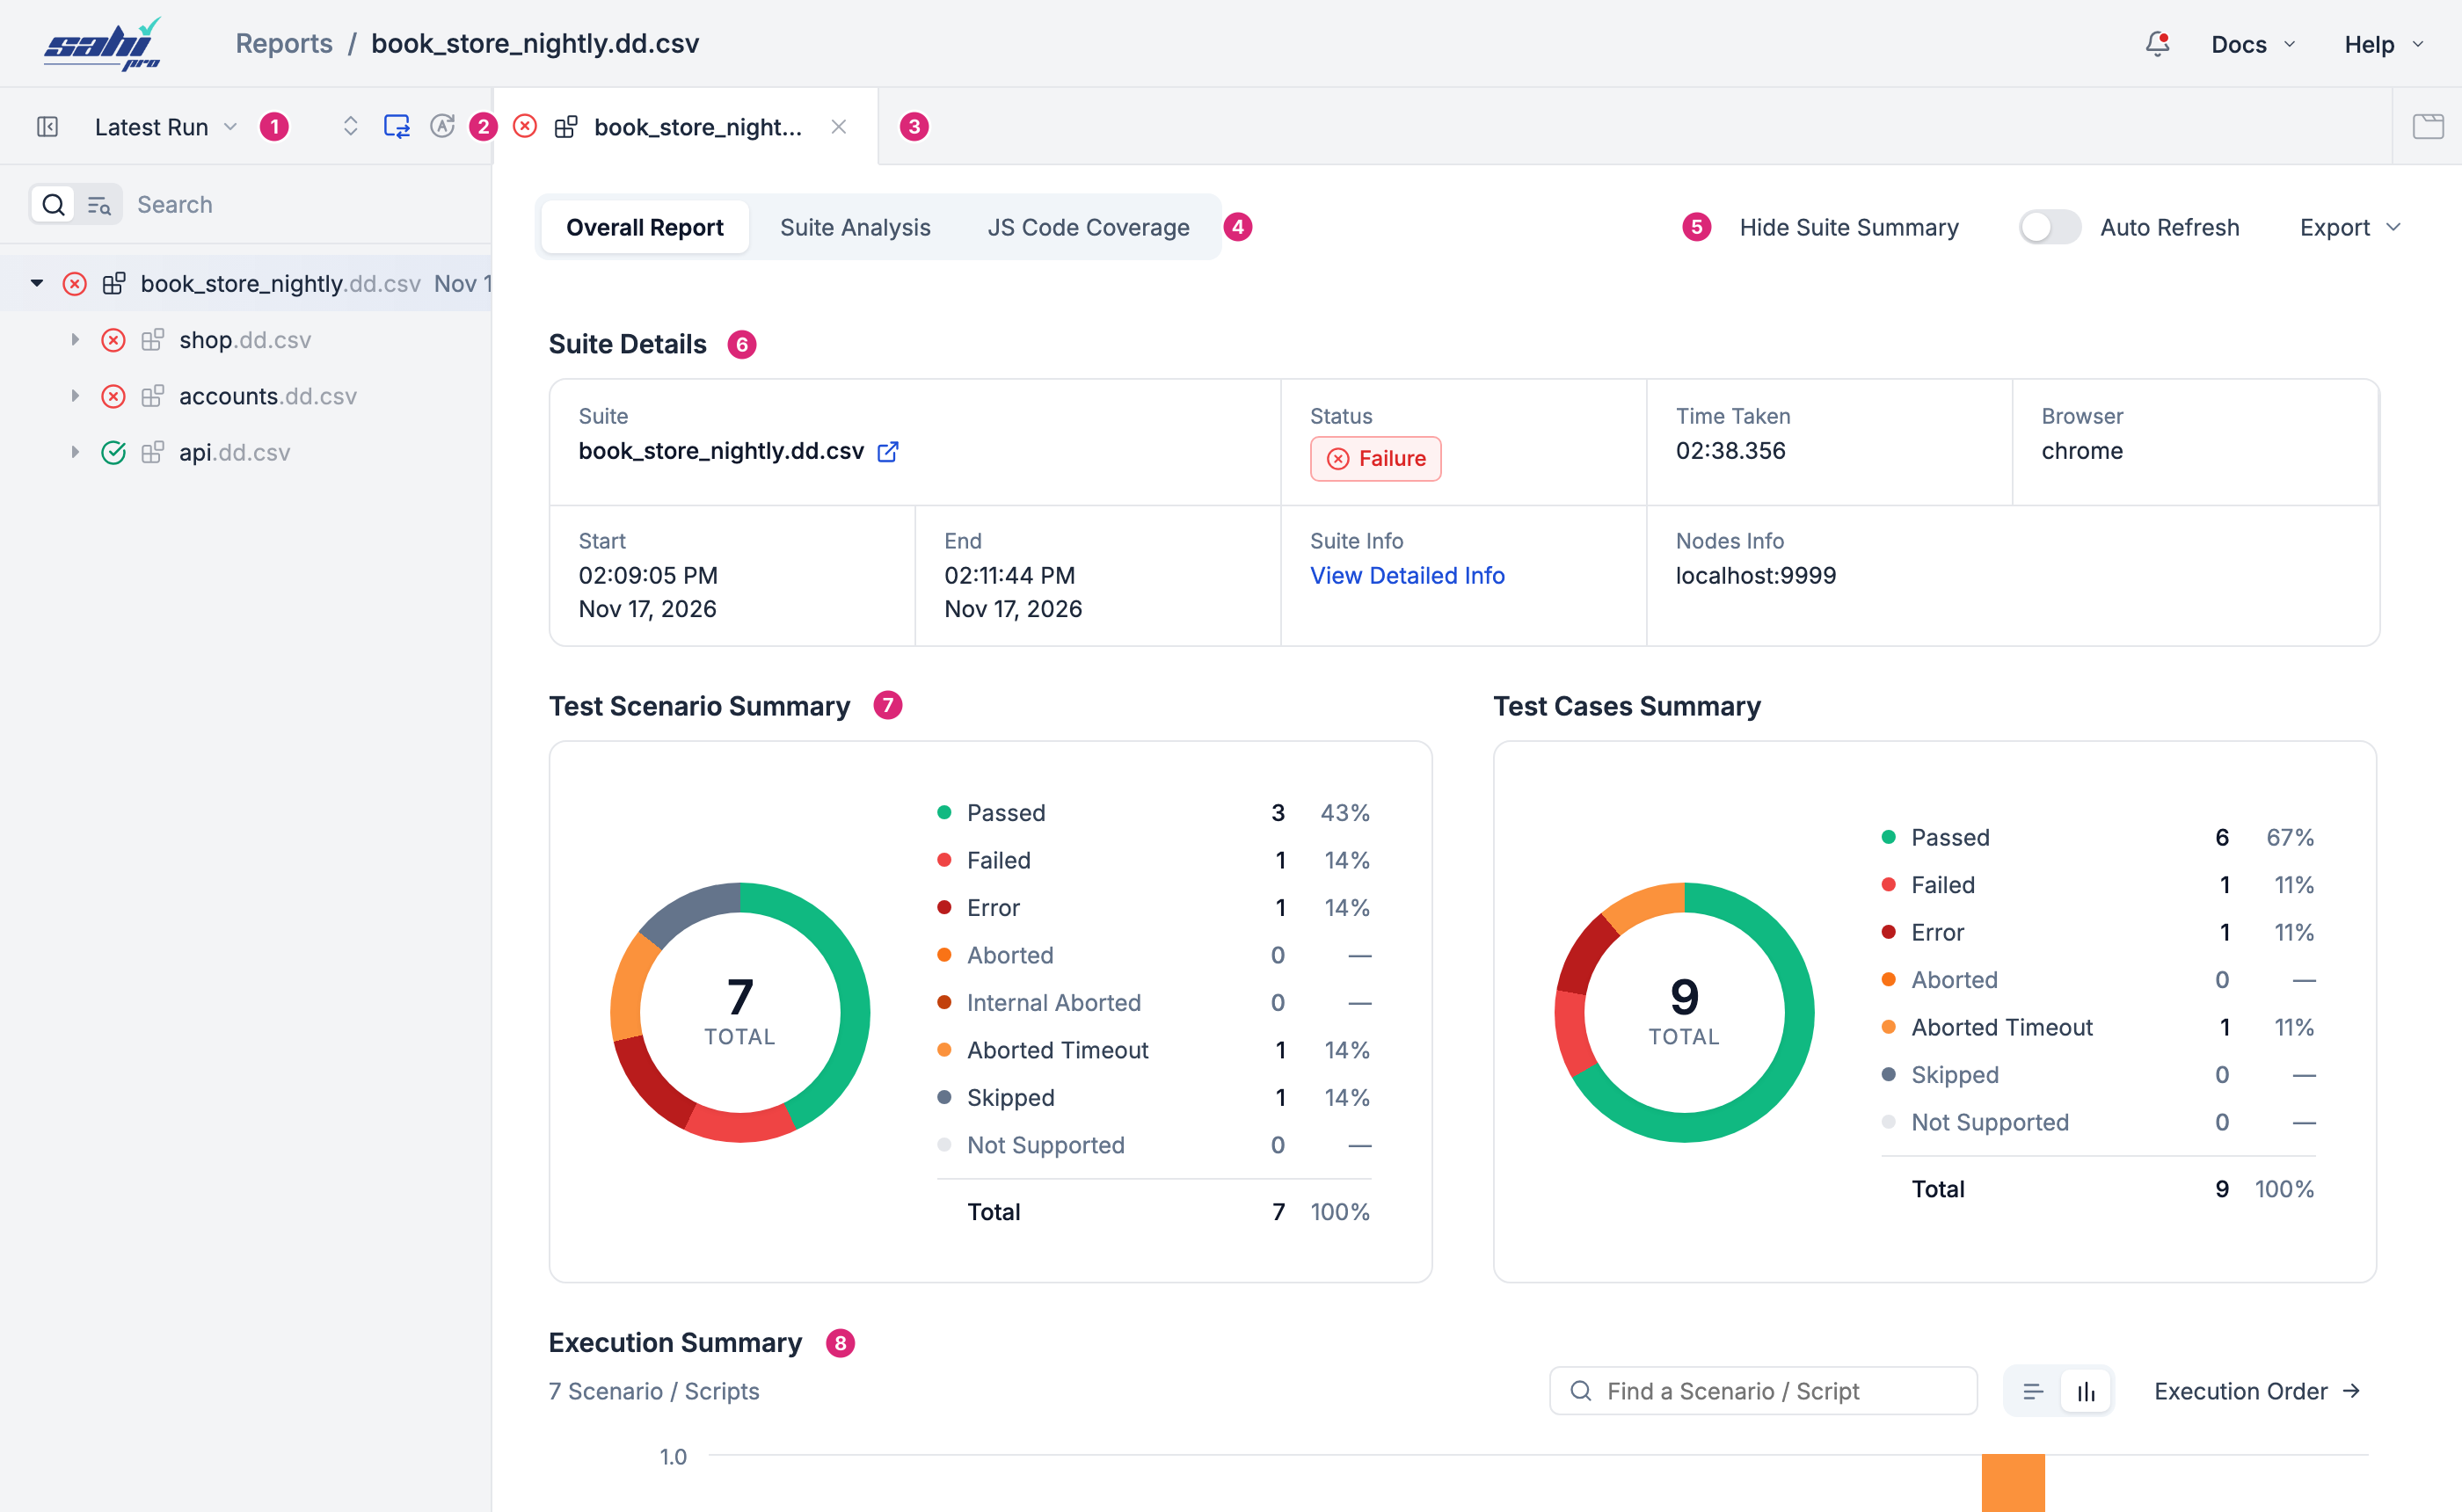
- Latest Run / All Runs: which runs the navigator shows.
- Navigator tools: expand or collapse the tree, show the open report in the tree, and turn on Auto Refresh for the navigator.
- Report tabs: each report you open, suite or scenario file, opens in its own tab. Click Show all open tabs at the right to list them.
- Report views: Overall Report, Suite Analysis and JS Code Coverage.
- Hide Suite Summary, Auto Refresh and Export.
- Suite Details.
- Test Scenario Summary and Test Cases Summary.
- Execution Summary, followed by the scenario files in the run.
The Navigator
Section titled “The Navigator”The navigator on the left shows the suite as a tree, with the same nesting as the suite file: a suite holds the scenario files and scripts in it, and a suite inside a suite shows as a branch of its own. A status icon next to each item shows how it ended. Click an item to open its report in a tab.
-
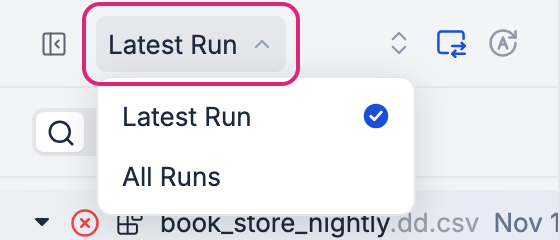
Latest Run shows the latest run of the suite. Choose All Runs to list the earlier runs below it, and open any of them:
-
Search narrows the tree to the items whose names match. Switch to Find to keep the whole tree and highlight the matches instead, then move between them with the arrows.
-
Collapse Navigator, at the far left, hides the navigator to give the report more room.
The tabs and the navigator stay as you left them, even after you reload the page.
Suite Details
Section titled “Suite Details”Suite Details shows the suite file, the run’s status, the time taken, the browser, and when the run started and ended.

- Click the icon next to the suite’s name to open the suite file.
- View Detailed Info, under Suite Info, lists every setting the run used, such as the start URL, the browser, the retry counts and whether Autoheal was on. Check it when a run behaves differently from the last one.
- Nodes Info lists the machines that ran the suite. A distributed run shows each node.
Result Charts
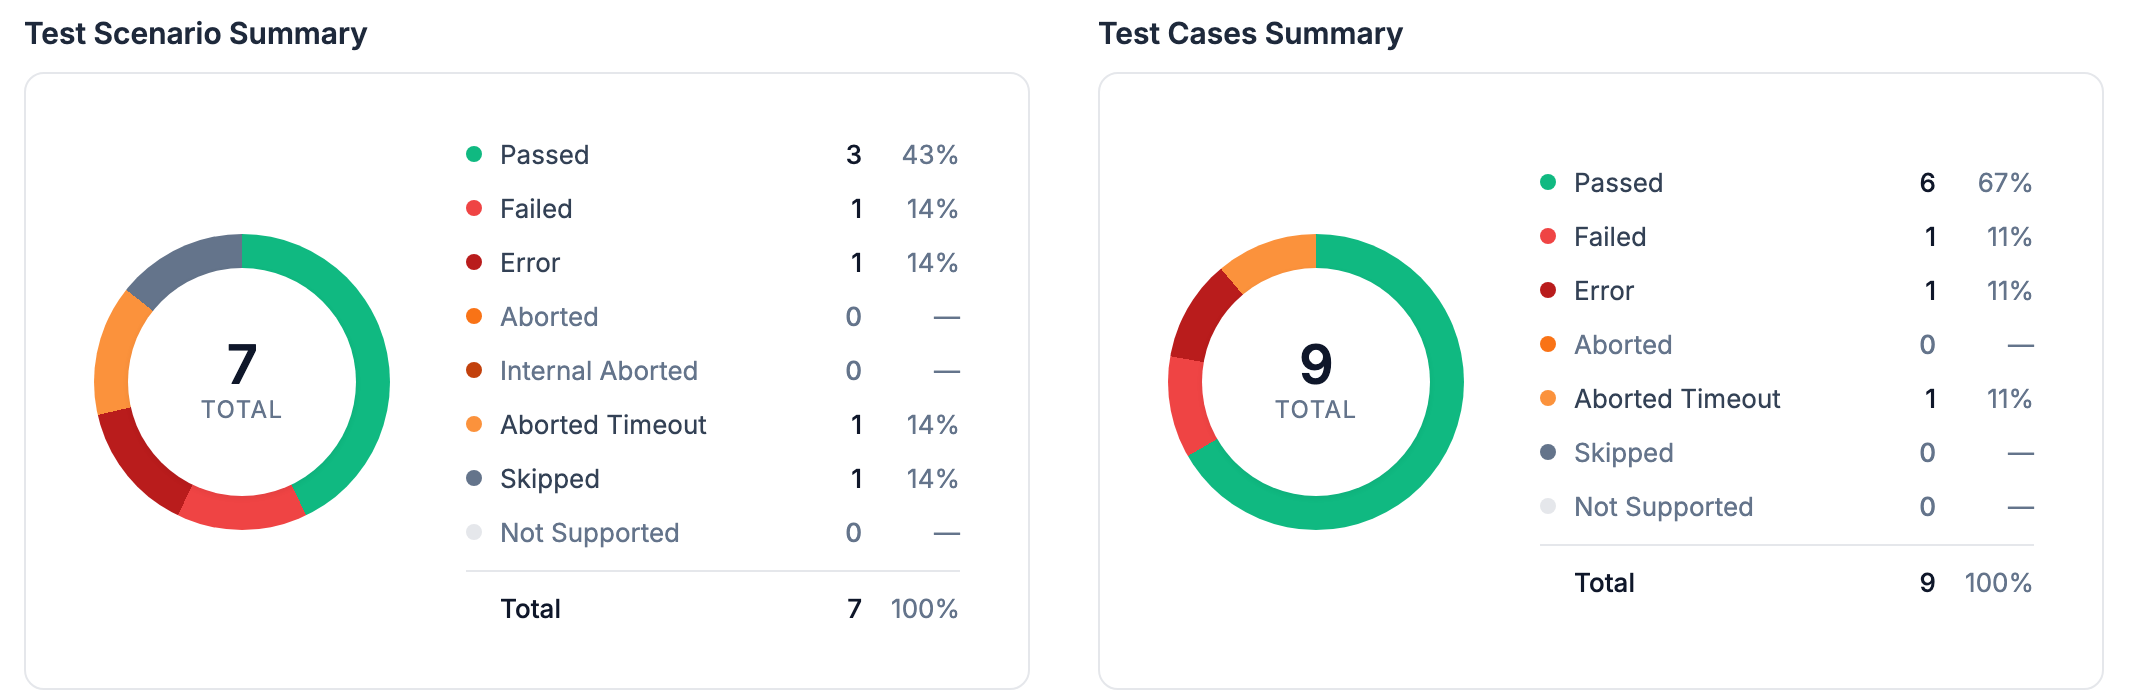
Section titled “Result Charts”Test Scenario Summary counts the scenario files and scripts that ended with each status. Test Cases Summary counts the test cases. Each status shows its number and its share of the total, and the ring in the middle shows the total.
Execution Summary
Section titled “Execution Summary”Execution Summary shows how long each scenario file took, as a bar in its status colour. Use it to find the slow ones, or a file that took far longer than usual. Hover a bar to see its name and time.
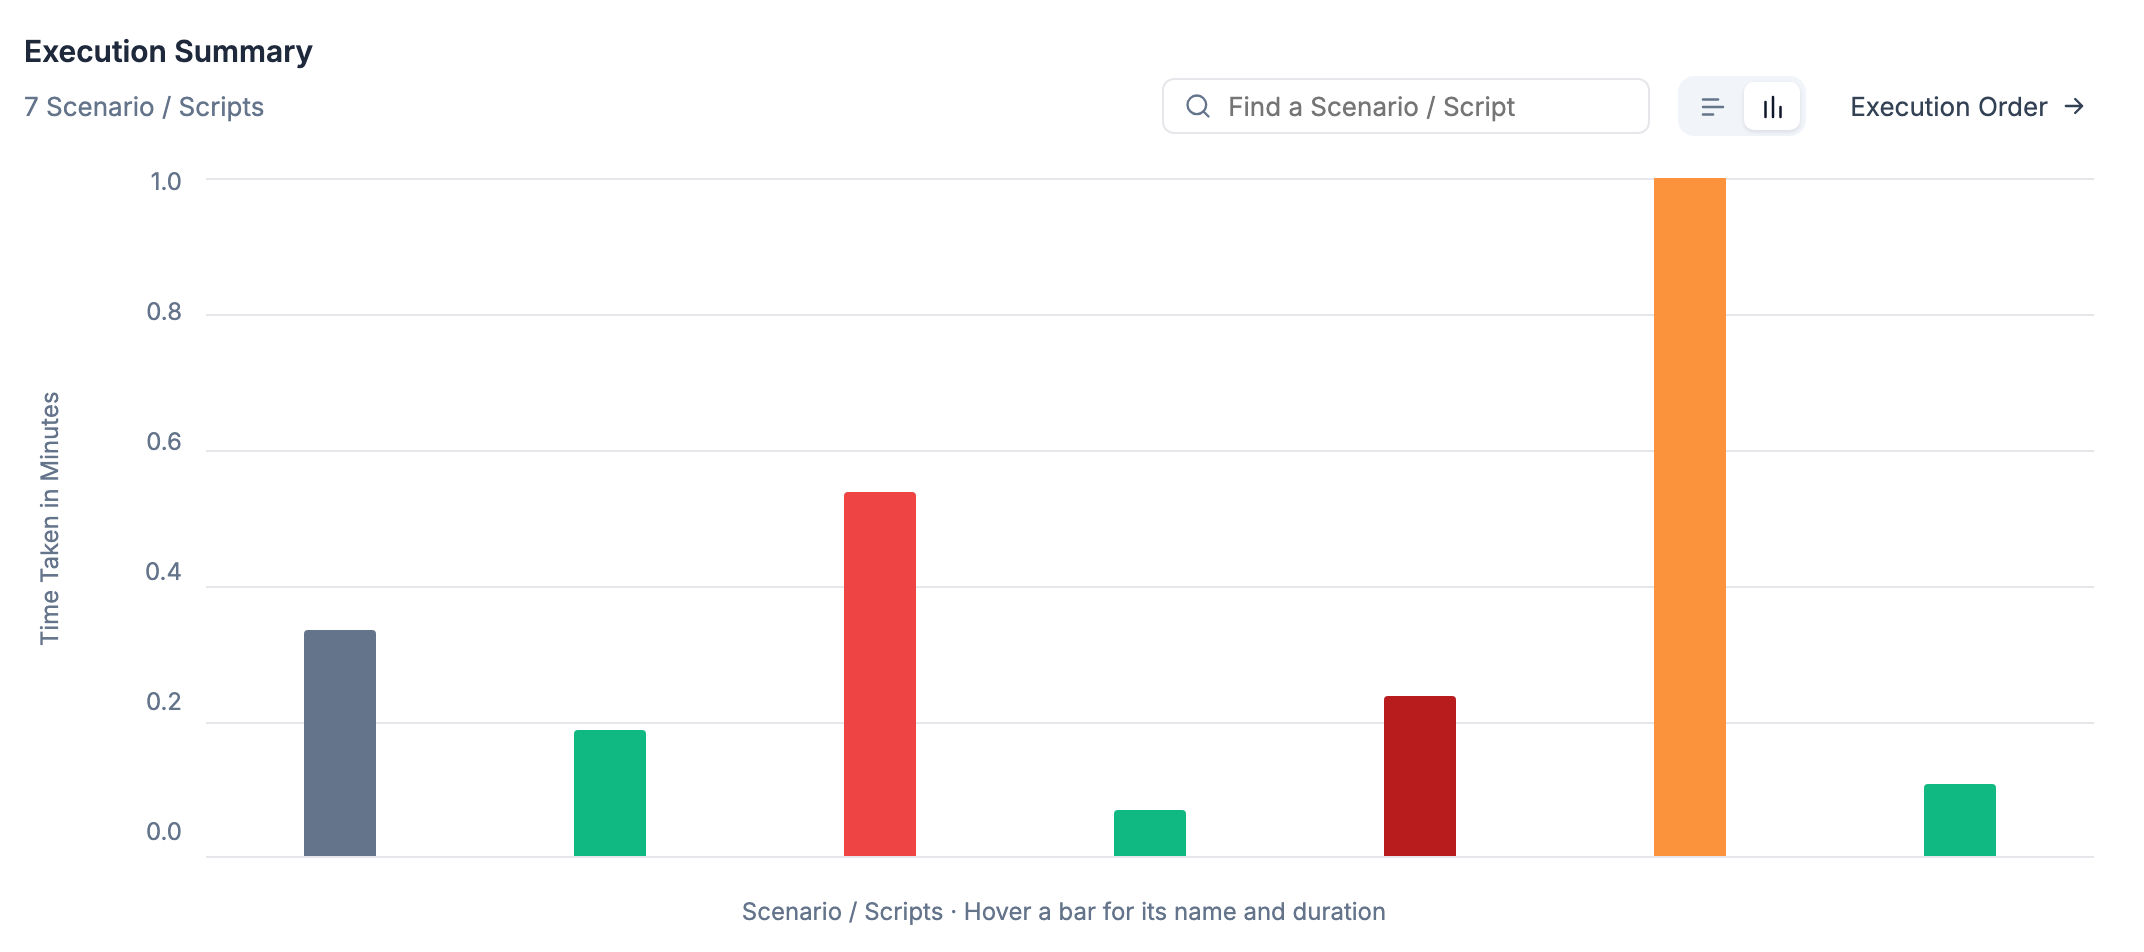
- Find a Scenario / Script picks out one file in the chart.
- The two buttons switch between horizontal and vertical bars.
- Execution Order sorts the bars by the order the files ran in. Click it again to sort by time taken, longest first.
Scenario Files and Scripts
Section titled “Scenario Files and Scripts”Below the charts, every scenario file and script in the run is listed with its result. A suite inside the suite shows as a row of its own, with the number of scripts and test cases in it. Click the arrow at the start of a row to see its test cases:
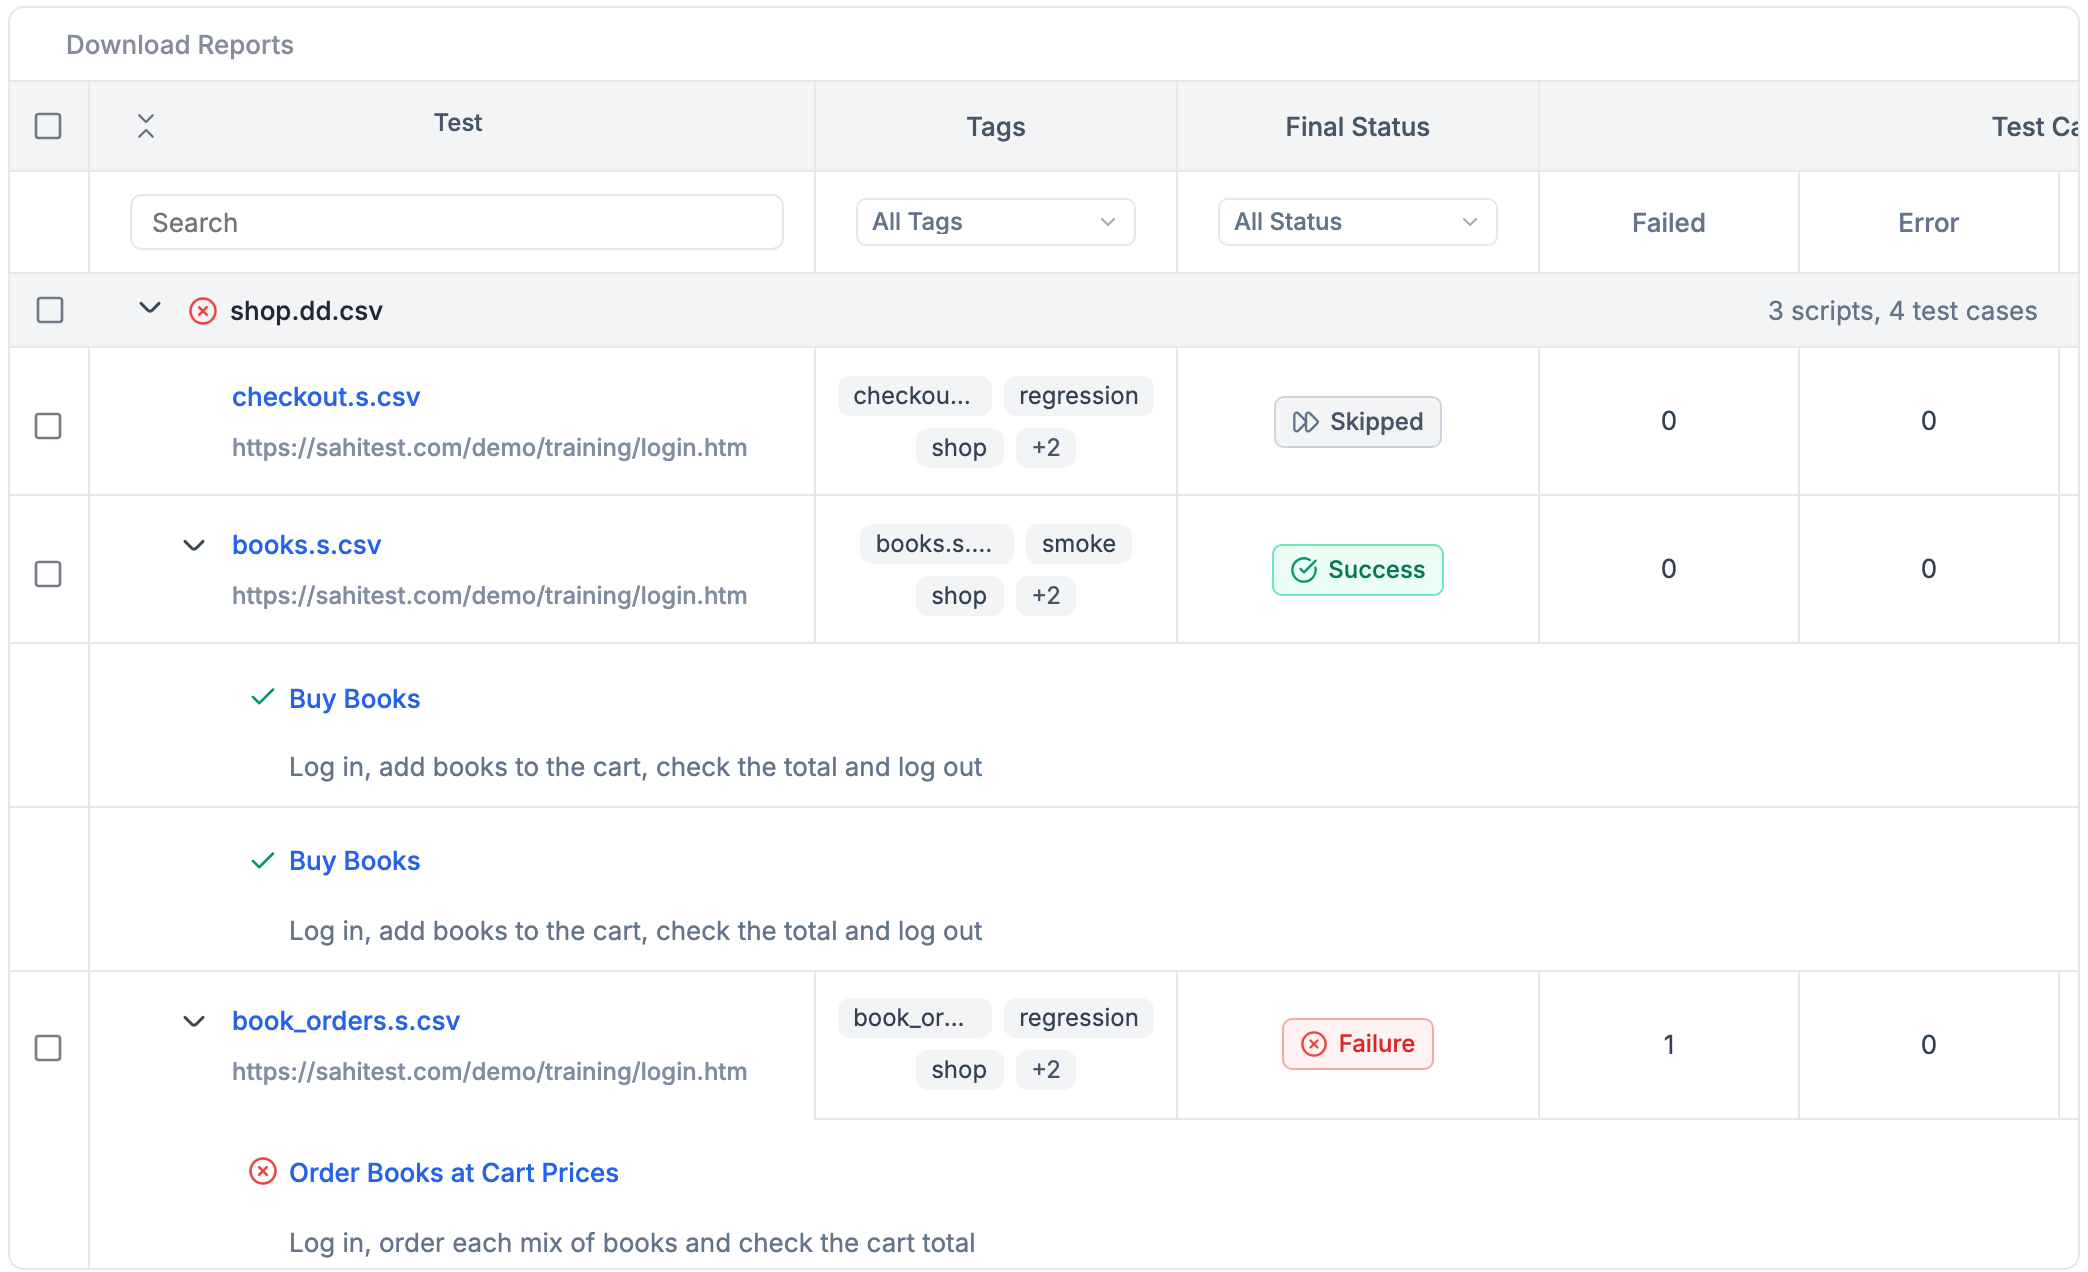
| Column | What it shows |
|---|---|
| Test | The scenario file or script, with its start URL. Click it to open its script report. Under it, each test case with its description. |
| Tags | The file’s tags. Sahi Pro also adds the file’s name and the suite it’s in. |
| Final Status | How the file ended. |
| Test Cases | How many test cases failed or hit an error, the success rate and the total. |
| Start Time, Time Taken | When the file started and how long it took. |
| Intermediate Statuses | The intermediate status, such as FAILURE or HEALED. |
| Node | The machine that ran the file. |
| Load | The machine’s load, for distributed runs. |
The columns on the right scroll into view:
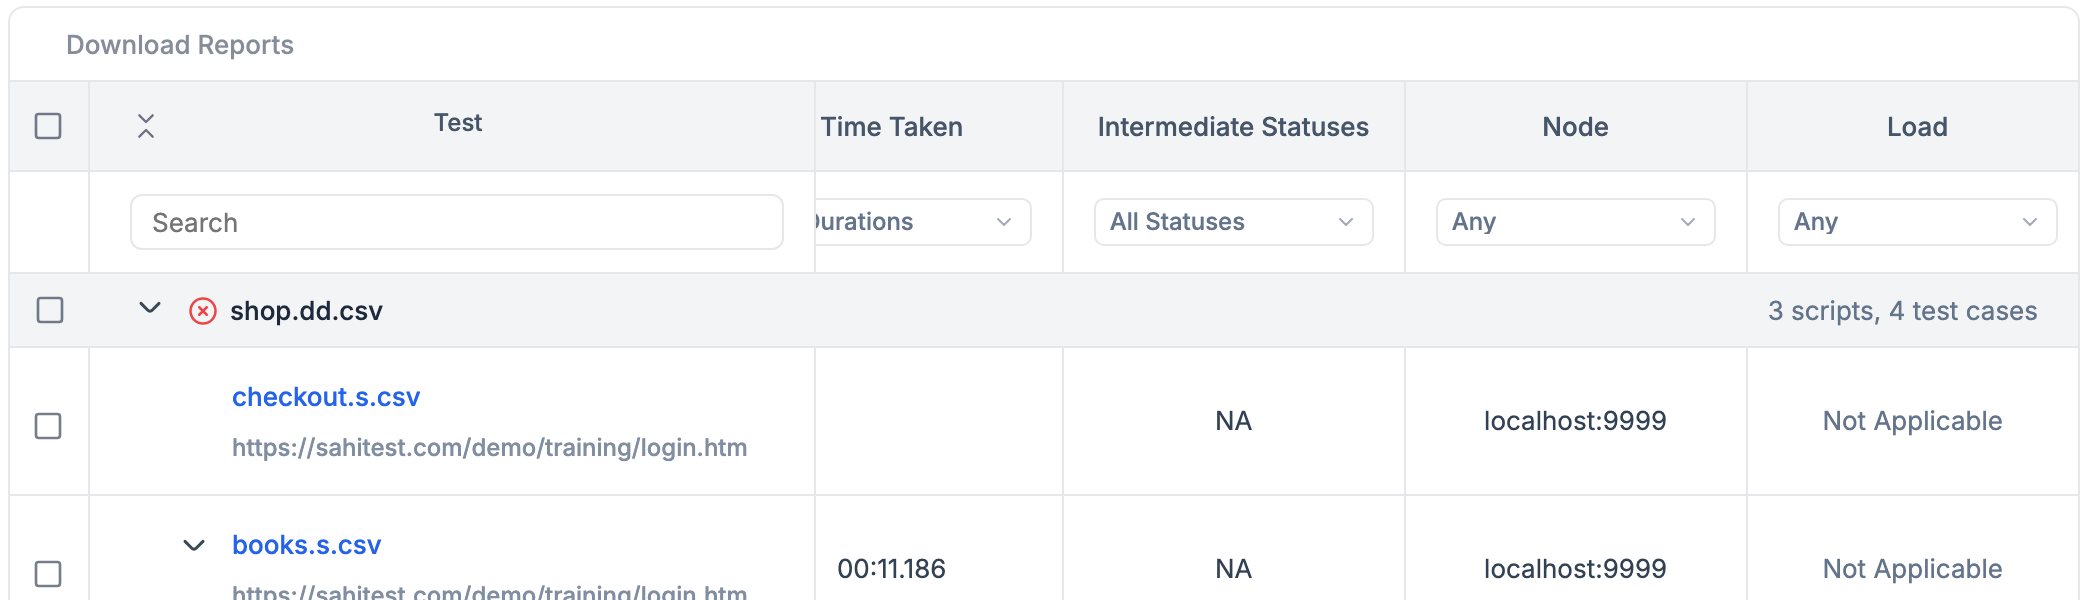
Each column has a filter, such as All Tags, All Status, durations (Under 1 min, 1 - 5 min, 5 - 10 min, Over 10 min), intermediate statuses and nodes. The search box finds a file or test case by name. Expand All opens every row.
To download the reports of only some files, tick them and click Download Reports.
Watch a Running Suite
Section titled “Watch a Running Suite”Turn on Auto Refresh to follow a suite while it runs. The report reloads every 2 seconds until the run ends.
Export
Section titled “Export”Export saves the report as a file:
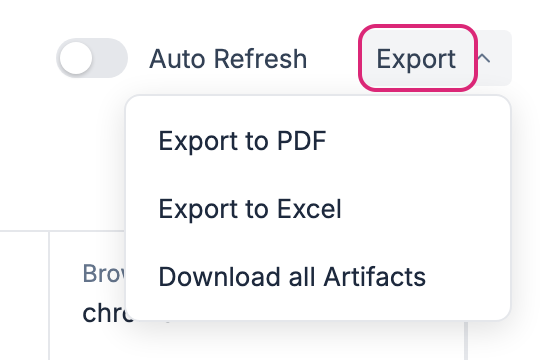
- Export to PDF saves the report as a PDF, for sharing with people who don’t use Sahi Pro.
- Export to Excel saves the results as a spreadsheet.
- Download all Artifacts downloads the files the run saved, such as screenshots.
Suite Analysis and JS Code Coverage
Section titled “Suite Analysis and JS Code Coverage”- Suite Analysis shows which scenario files failed in this run and how they did in earlier runs, and which steps caused failures or were healed. See Suite Analysis.
- JS Code Coverage shows how much of the application’s JavaScript the run used. See Javascript Code Coverage.