

Run Tests via Editor
Run scenario files, keyword files and suites from the Test Scenario Editor: the Run Configuration, parallel and distributed suite runs, advanced settings, scheduling, export to Ant or Gradle, and debugging.
The Test Scenario Editor runs anything you open or select in it: one scenario file, a keyword file or a whole suite. One Run Configuration sets where the tests run, which of them run, and how.
Open the Run Configuration
Section titled “Open the Run Configuration”Click Run in the top menu to open the Run Configuration for the open file. To run several files, select them in the Navigator first: Sahi Pro puts them in a suite, selectedScripts.suite, and runs that.
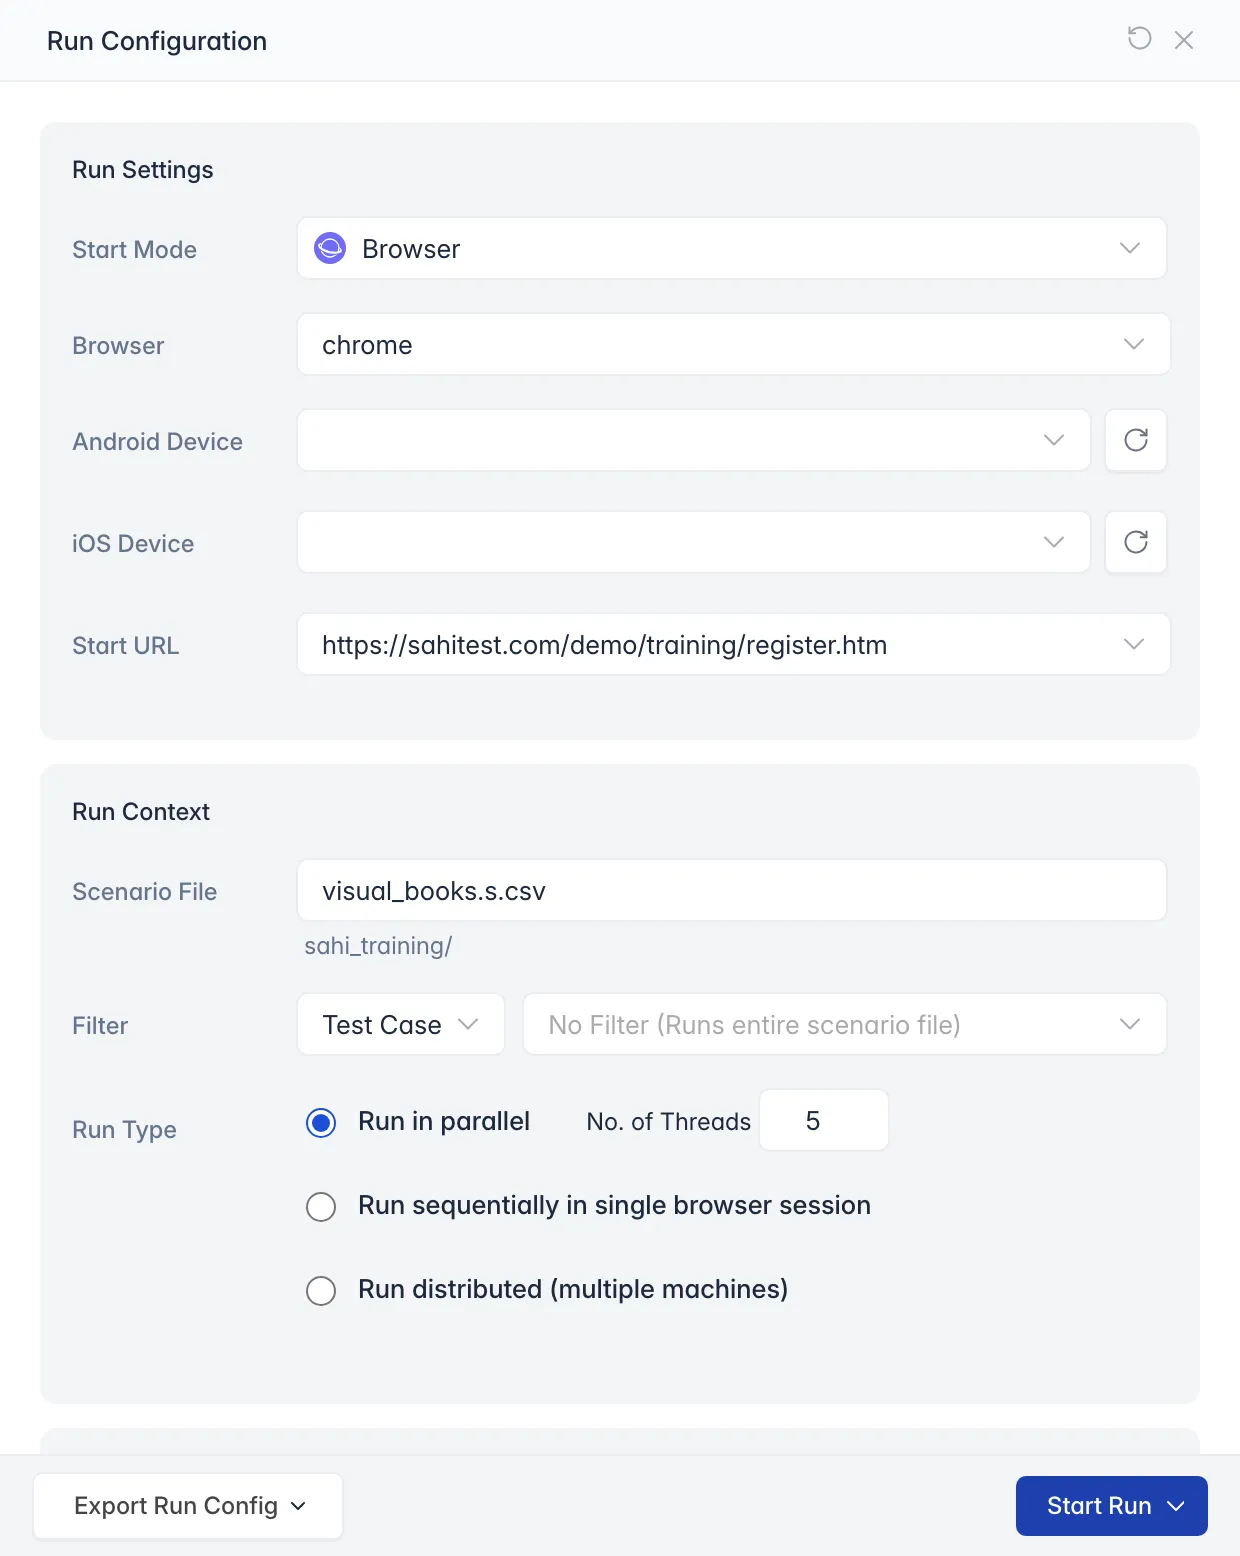
Run Settings
Section titled “Run Settings”- Start Mode: what the test starts on: Browser, Java, Android Browser, Android, iOS Browser or iOS. Generic starts in the mode the test sets itself with _setMode. Engines you install add their modes, such as Windows and SAP.
- Browser: one or more browsers to run in. For distributed suite runs, it lists the browsers on all nodes.
- Android Device and iOS Device: the device for Android and iOS modes.
- Start URL: the page the test starts on.
- Filter: for a scenario file or a suite, run only some Test Cases, or the test cases with some Tags. Tags can be combined, as in
(admin||customer)&&smoke.
Run Type
Section titled “Run Type”- Run in parallel: runs as many tests at once as No. of Threads (5 by default), each in its own browser. With 1 thread, the tests run one after another, each in a new browser.
- Run sequentially in single browser session: runs the tests one after another in the same browser, which closes only at the end. Use it with care: one test can leave the browser in a state the next one doesn’t expect.
- Run distributed (multiple machines): see Distributed Suite Runs.
Click Start Run to run.
Distributed Suite Runs
Section titled “Distributed Suite Runs”A large suite takes hours on one machine. Spread it across machines to finish sooner:
-
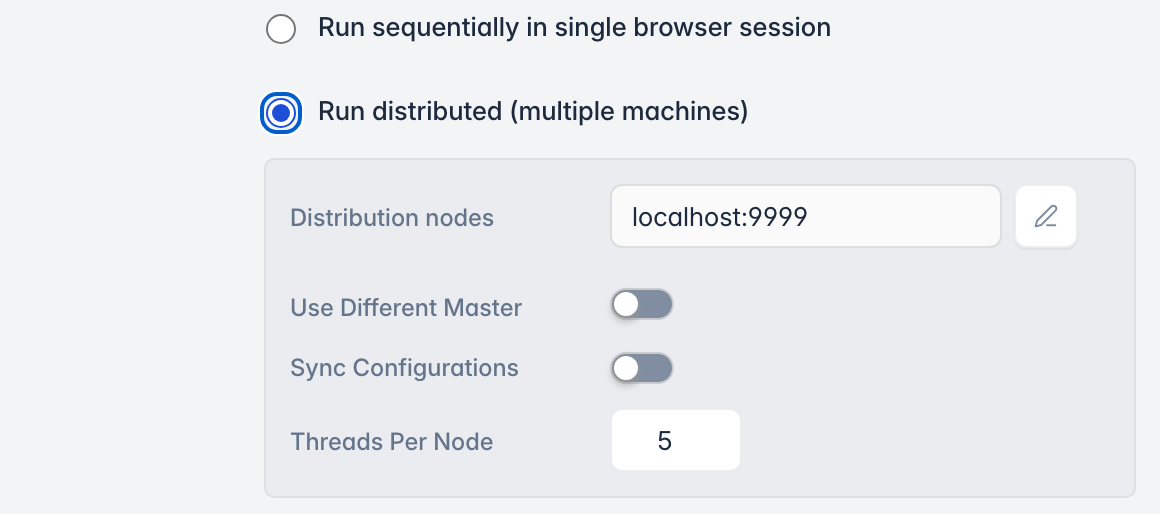
Choose Run distributed (multiple machines).
-
In Distribution nodes, click the edit button and add each machine’s name and port. Uncheck Use to leave a node out without deleting it.
-
Set Threads Per Node.
-
To run the suite from another machine than this one, turn on Use Different Master and enter its name and port (9999 by default).
-
Turn on Sync Configurations to copy these settings files to every node for this run:
Files that are synced
- download_urls.txt, donot_download_urls.txt, download_contenttypes.txt
- response_headers_remove.txt, streaming_urls.txt, streaming_contenttypes.txt
- passthrough_ws_ssh_domains.txt, block_ssl_domains.txt, ssl_host_port.txt
- content_detection.txt, exclude_inject.txt, force_inject.txt
- code_coverage_js.txt, code_coverage_js_exclude.txt
- substitutions.xml, user_extensions.js, user_extension_android.js
- sync_db.properties, email.properties, sync_email_trigger.txt
- xhr_ready_states_wait_for_urls.txt
- accessor_metadata: metadata.properties, flex.json, html.json, java.json, mswindows.json, oracle.json, polymer.json, salesforce.json, sap.json, android.json, ios.json
Advanced Run Settings
Section titled “Advanced Run Settings”Open Advanced Settings at the bottom of the Run Configuration.
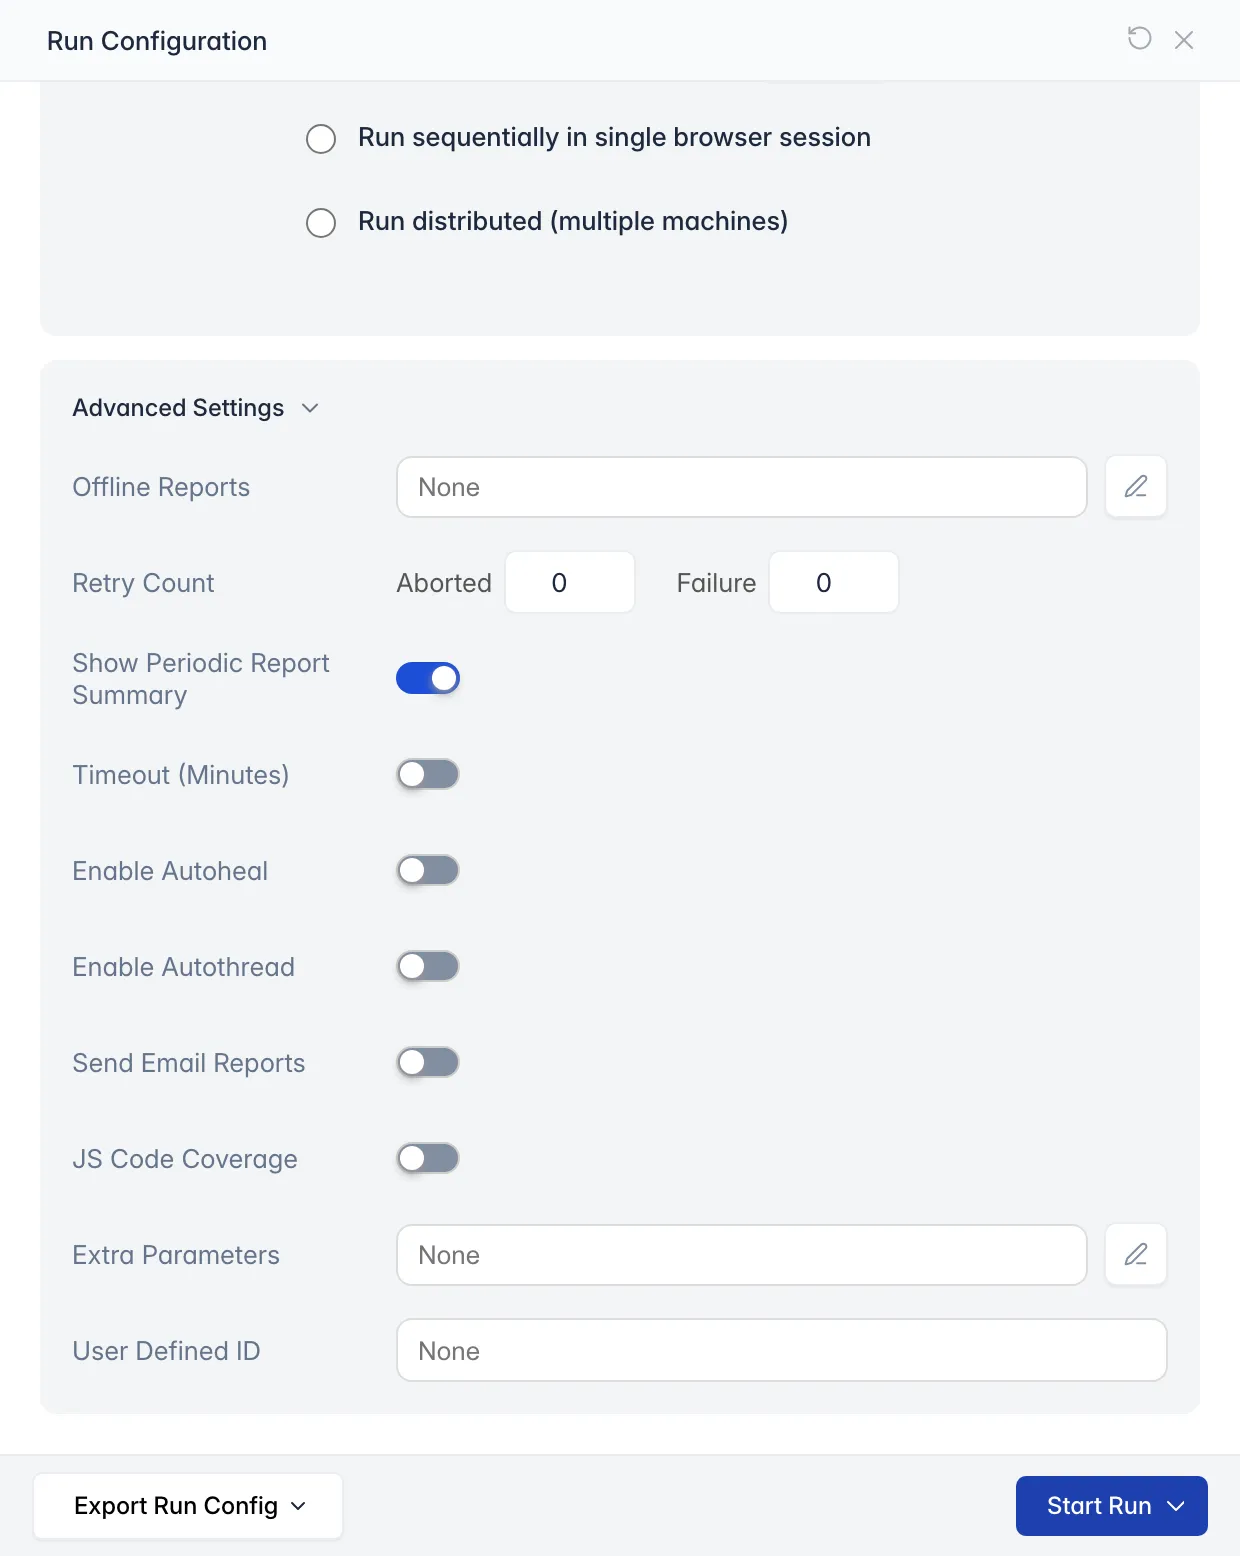
- Offline Reports: saves reports as files, such as HTML or JUnit. Click the edit button, check Use for each type you want and set its folder.
- Retry Count: runs a test again straight away if it ends Aborted or as a Failure, up to the number you set (0 by default).
- Show Periodic Report Summary: shows the suite’s progress while it runs. See Periodic Summary during Script Runs.
- Timeout (Minutes): stops a suite that runs longer than this, with the status ABORTED_TIMEOUT. To set a timeout per suite or test, see Test Suites.
- Enable Autoheal: finds an element another way when its accessor no longer matches. Turn it on when the application changes often. See Autoheal.
- Enable Autothread: stops launching new browsers while CPU use is above a threshold.
- Send Email Reports: emails the report on success, failure or both, after each sub suite, or at intervals while a long suite runs. The settings are in
userdata/config/email.properties, and none are set by default. See Email Properties and Templates. - JS Code Coverage: collects JavaScript code coverage. See JavaScript Code Coverage.
- Extra Parameters: passes name and value pairs to the tests. Check Mask to hide a value, such as a password, from reports.
- User Defined ID: an ID of your own for the run. To show it in reports, set
showUserDefinedIdto'true'inuserdata/config/reports/suites_list.xsl.
Other settings show when they apply: Avoid Skipping runs a test even if a test it depends on failed (see Test Suites), and Git Log Integration adds Git details to reports.
Export to Ant or Gradle
Section titled “Export to Ant or Gradle”To run the same configuration from a build server, click Export Run Config and choose Ant Target, Gradle Task (Groovy) or Gradle Task (Kotlin). See Run Tests via Ant and Run Tests via Gradle.
Schedule a Run
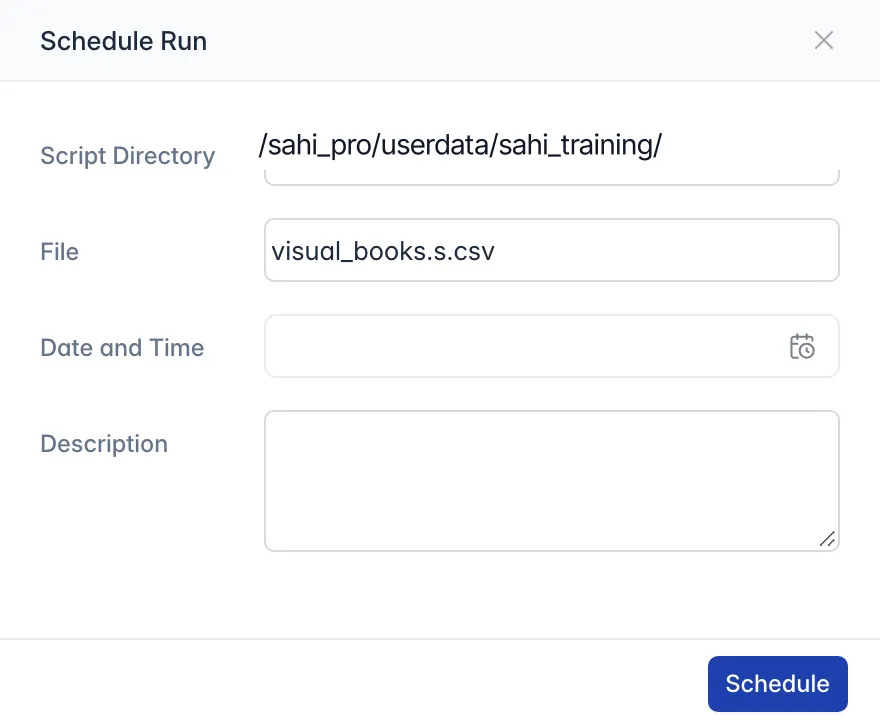
Section titled “Schedule a Run”To run tests later, such as overnight, open the arrow on Start Run and choose Schedule Run. Pick the Date and Time, add a Description if you like, and click Schedule. A notification confirms it.
Debug a Test
Section titled “Debug a Test”When a test fails partway, stop it just before the failing step and look at the page:
- In a keyword file, click left of a line number to add a breakpoint. A red dot marks it.
- Open the arrow on Start Run and choose Run in Debug Mode.
- The run stops at the breakpoint and the Controller opens. Click Step to run the next line, or Play to go on. See Pause and Step Through a Run.
To remove all breakpoints in all files, choose Tools > Clear Break Points.
Periodic Summary during Script Runs
Section titled “Periodic Summary during Script Runs”When you run tests from the Editor, Ant, Testrunner or Drun, Sahi Pro prints a summary each time a test’s status changes: in the console, or as a notification in the Editor.
A sample periodic summary in the Ant, Testrunner or Drun console looks like this:
INFO: #### Running Script: D:/dev/temp/Nov18/userdata/scripts/sahitests/label.sahINFO: Acquired available browser instance after retries:0 threadNo:1Rhino lib: startMode = BROWSERRhino lib:Setting mode: BROWSERINFO: #### Running Script: D:/dev/temp/Nov18/userdata/scripts/sahitests/screenSize.sahRhino lib: startMode = BROWSERRhino lib:Setting mode: BROWSERKilling D:/dev/temp/Nov18/userdata/scripts/sahitests/label.sahKilling D:/dev/temp/Nov18/userdata/scripts/sahitests/screenSize.sahThere are two kinds of messages:
[timestamp] [status: scriptname] [BROWSER: browsername][timestamp] [Testcases: passed/total_ran] [Scripts: passed/total_ran] [BROWSER: browsername]| Field | Meaning |
|---|---|
| timestamp | Time Stamp of the Initiator machine. |
| status: scriptname | Status of the script (STARTED, PASSED, FAILED) followed by script name. |
| Testcases: passed / total_ran | Total number of testcases passed / Total number of testcases executed. |
| Scripts: passed / total_ran | Total number of scripts passed / Total number of scripts executed. |
| BROWSER: browsername | Browser on which the script was executed. |